This document contains 6 math problems involving graphing functions. Each problem has parts that involve:
1) Completing a table of values for a function.
2) Graphing the function on graph paper using given scales.
3) Finding specific values from the graph.
4) Drawing and finding values from a linear function related to the original.
The problems provide practice graphing and extracting information from graphs of quadratic, cubic, rational, and other polynomial functions. The document demonstrates how to set up and solve multi-step math word problems involving graphing functions.
The document contains 20 multiple choice questions from an exam for the Naval School in 2017. The questions cover topics such as combinations, functions, limits, integrals, complex numbers, and geometry.
The document contains 15 multiple choice questions from an IME 2018 exam. The questions cover topics such as determinants, functions, systems of equations, geometry, complex numbers, polynomials, trigonometry, and number representations in different bases. A key is provided with the correct answer for each question labeled A through E.
The document contains 38 multiple choice questions from an unsolved mathematics past paper from 2007. The questions cover topics such as functions, relations, complex numbers, logarithms, trigonometry, matrices, integrals, conic sections, and coordinate geometry.
1. The document is a model question paper with 3 sections containing multiple choice and long answer questions on mathematics.
2. Section A contains 15 multiple choice questions worth 1 mark each. Section B contains 10 long answer questions worth 2 marks each. Section C contains 9 long answer questions worth 5 marks each and 1 compulsory question.
3. The questions cover topics in algebra, trigonometry, geometry, sequences and series, and probability.
This document discusses rational functions, which are defined as the ratio of two polynomials. It provides examples of specific rational functions and examines their key properties including vertical and horizontal asymptotes. It discusses how to predict asymptotes from the polynomials and emphasizes the importance of graphing to verify predictions. Guidelines are provided for accurately graphing rational functions on graph paper including showing intercepts, extrema, asymptotes, holes, and using proper scaling.
- The document contains 23 multiple choice questions about inequalities.
- The questions cover topics such as solving systems of inequalities, determining the number of solutions to inequalities, identifying the solution set of inequalities, and analyzing functions using inequalities.
- Several questions provide contextual word problems involving applications of inequalities such as probability, construction costs, and sums of integer values.
The document discusses drawing graphs of different types of functions, including linear, quadratic, cubic, and reciprocal functions. It provides the general forms of each type of function, describes the steps to draw their graphs which include constructing a table of values, plotting points, and joining the points. As an example, it shows the graph of a reciprocal function f(x) = 1/x for -1 ≤ x ≤ 1.5, which forms a hyperbola shape.
The document provided is a blue print for a mathematics exam for class 12. It lists various topics that could be included in the exam such as functions, derivatives, integrals, differential equations, 3 dimensional geometry etc. It specifies the number and type of questions (VSA, SA, LA) that may be asked from each topic along with the marks allocated. A total of 100 marks have been allocated with 29 questions. Section A will have 10 one mark questions, Section B will have 12 four mark questions and Section C will have 7 six mark questions. An example question paper format in line with this blue print is also provided.
The document is about quadratic polynomial functions and contains the following information:
1. It discusses investigating relationships between numbers expressed in tables to represent them in the Cartesian plane, identifying patterns and creating conjectures to generalize and algebraically express this generalization, recognizing when this representation is a quadratic polynomial function of the type y = ax^2.
2. It provides examples of converting algebraic representations of quadratic polynomial functions into geometric representations in the Cartesian plane, distinguishing cases in which one variable is directly proportional to the square of the other, using or not using software or dynamic algebra and geometry applications.
3. It discusses characterizing the coefficients of quadratic functions, constructing their graphs in the Cartesian plane, and determining their zeros (
The document contains 20 multiple choice questions from an exam for the Naval School in 2017. The questions cover topics such as combinations, functions, limits, integrals, complex numbers, and geometry.
The document contains 15 multiple choice questions from an IME 2018 exam. The questions cover topics such as determinants, functions, systems of equations, geometry, complex numbers, polynomials, trigonometry, and number representations in different bases. A key is provided with the correct answer for each question labeled A through E.
The document contains 38 multiple choice questions from an unsolved mathematics past paper from 2007. The questions cover topics such as functions, relations, complex numbers, logarithms, trigonometry, matrices, integrals, conic sections, and coordinate geometry.
1. The document is a model question paper with 3 sections containing multiple choice and long answer questions on mathematics.
2. Section A contains 15 multiple choice questions worth 1 mark each. Section B contains 10 long answer questions worth 2 marks each. Section C contains 9 long answer questions worth 5 marks each and 1 compulsory question.
3. The questions cover topics in algebra, trigonometry, geometry, sequences and series, and probability.
This document discusses rational functions, which are defined as the ratio of two polynomials. It provides examples of specific rational functions and examines their key properties including vertical and horizontal asymptotes. It discusses how to predict asymptotes from the polynomials and emphasizes the importance of graphing to verify predictions. Guidelines are provided for accurately graphing rational functions on graph paper including showing intercepts, extrema, asymptotes, holes, and using proper scaling.
- The document contains 23 multiple choice questions about inequalities.
- The questions cover topics such as solving systems of inequalities, determining the number of solutions to inequalities, identifying the solution set of inequalities, and analyzing functions using inequalities.
- Several questions provide contextual word problems involving applications of inequalities such as probability, construction costs, and sums of integer values.
This document provides examples and explanations for graphing quadratic functions of the form y = ax^2 + bx + c, discussing how the graphs are affected by the values of a, b, and c, including cases where a > 1, a < 1, and vertical translations based on c. Examples show creating tables of values, plotting points, drawing curves, and comparing graphs to y = x^2.
The document discusses the fundamental theorem of algebra and properties of complex zeros of polynomials. It provides examples of finding all zeros of polynomials by factoring, using the quadratic formula, and the difference of squares/cubes formulas. It also demonstrates using the "sum and product method" to find the polynomial of lowest degree with given complex zeros, which involves taking the sum and product of the zeros.
This document contains 20 algebra problems with multiple choice answers. The problems cover topics such as evaluating expressions, simplifying polynomials, factoring expressions, solving equations, and graphing lines. The solutions are provided.
Peperiksaan pertengahan tahun t4 2012 (2)normalamahadi
This document contains 12 mathematics questions testing skills such as solving simultaneous linear equations, quadratic equations, calculating areas and perimeters of shapes, set theory, and logical reasoning. The questions cover topics like functions, sequences, proportions, geometry, and Venn diagrams. Students are required to show their work and provide answers for full marks.
This document contains notes and formulae on additional mathematics for Form 4. It covers topics such as functions, quadratic equations, quadratic functions, indices and logarithms, coordinate geometry, statistics, circular measure, differentiation, solutions of triangles, and index numbers. The key points covered include the definition of functions, the formula for the sum and product of roots of a quadratic equation, the axis of symmetry and nature of roots of quadratic functions, and common differentiation rules.
The document contains 20 multiple choice questions about polynomials. The questions cover topics such as solving polynomial equations, finding the remainder of polynomial division, relationships between the coefficients and roots of polynomials, and interpreting graphs of polynomial functions. The correct answers to each question are provided in a key at the end.
The document contains 20 multiple choice questions related to systems of linear equations. The questions cover topics such as determining the number of solutions to a system, properties of matrices, and using systems of equations to solve word problems. Sample questions ask the learner to determine the number of possible values for a variable that would make a given system possible and indeterminate, or to identify properties of matrices that would satisfy certain conditions.
This document provides a marking scheme for an Additional Mathematics paper 2 trial examination from 2010. It consists of 7 questions, each with multiple parts. For each question, it lists the number of marks awarded for various steps in the solutions, such as setting up the correct formula, performing calculations accurately, obtaining the right solution, plotting points correctly, and using appropriate mathematical reasoning. The highest number of marks for a single question is 8 marks. The marking scheme evaluates multiple aspects of students' work and reasoning for 7 multi-step mathematics problems.
The document discusses graphing quadratic functions. It begins with reviewing key concepts like the vertex and axis of symmetry and how the a, b, and c coefficients affect the graph. Examples are provided for determining the width, direction opened, and vertical shift based on these coefficients. The remainder of the document provides step-by-step examples of graphing quadratic functions by finding the axis of symmetry, vertex, y-intercept, and other points to plot the parabolic curve.
1. The document provides instructions for students to use a graphing calculator application called Nspire to explore and analyze graphs of quadratic equations.
2. Students are asked to vary the values of a, b, and c in different quadratic equations and record the shape of the graph, location of maximum/minimum points, and equation of the line of symmetry.
3. The summary explains that graphs of quadratic equations with a positive coefficient of x^2 open up and have a maximum point, while those with a negative coefficient of x^2 open down and have a minimum point. The graph is always symmetrical around the line of symmetry passing through the maximum or minimum point.
This document provides information about a Core Mathematics C3 exam taken by Edexcel students. It includes instructions for students taking the exam, information about materials allowed and provided, and 8 questions testing various calculus, geometry, and trigonometry concepts. The exam is 1 hour and 30 minutes long and contains a total of 75 marks across the 8 questions. Students are advised to show their working clearly and label answers to parts of questions.
This document provides a tutorial on topics related to calculus including:
1) Differentiating various functions and finding points where the gradient is zero
2) Evaluating definite integrals of functions including trigonometric, exponential, and rational functions
3) Finding areas bounded by curves, axes, and lines by evaluating definite integrals
4) Sketching graphs of functions and finding relevant information like minimum/maximum points
5) Finding equations of tangents and normals to curves at given points
1. This document discusses linear equations, slope, graphing lines, writing equations in slope-intercept form, and solving systems of linear equations.
2. Key concepts explained include slope as rise over run, the different forms of writing a linear equation, finding the x- and y-intercepts, and using two points to write the equation of a line in slope-intercept form.
3. Examples are provided to demonstrate how to graph lines based on their equations in different forms, find intercepts, write equations from two points, and solve systems of linear equations.
The document provides instructions for a mathematics scholarship test. It explains that the test has 3 sections (Algebra, Analysis, Geometry), with 10 questions each for a total of 30 questions. Candidates should answer each question in the provided answer booklet, not on the question paper. Calculators are not allowed. The instructions also define various mathematical terms and notations used in the questions.
The document appears to be a blueprint for a mathematics exam for class 12. It lists various topics that could be covered in the exam such as functions, derivatives, integrals, differential equations, 3-dimensional geometry, and matrices. For each topic it indicates the number and type of questions that may be asked, such as very short answer (1 mark), short answer (4 marks), and long answer (6 marks). The total number of questions is 29 with 10 short answer questions worth 1 mark each, 12 questions worth 4 marks each, and 7 questions worth 6 marks each. The document also includes sample questions that cover the listed topics as examples of what may be asked on the exam.
This document contains 11 problems involving quadratic functions and equations. The problems cover graphing quadratic functions, solving quadratic equations by factoring and using the quadratic formula, identifying properties of quadratic functions, modeling real-world word problems with quadratic equations, and applying the Pythagorean theorem and properties of parabolas.
This document contains 15 multiple choice and free response questions about sinusoidal functions and their graphs. Key concepts covered include:
- Identifying amplitude, period, and phase shift from graphs of sinusoidal functions
- Writing equations to represent sinusoidal graphs in terms of sine and cosine
- Sketching transformed sinusoidal graphs (shifts, stretches, reflections)
- Finding amplitude, period, phase shift, and vertical/horizontal shifts from equations
- Relating sinusoidal equations to their real world applications like a roller coaster track
This document contains 15 multiple choice and free response questions about sinusoidal functions and graphs. It tests concepts like identifying amplitude, period, phase shift, and writing equations to represent sinusoidal graphs in terms of sine and cosine. The questions progress from identifying properties of given graphs and equations to sketching graphs, writing equations to represent graphs, and applying concepts to word problems involving real-world sinusoidal situations.
The study guide covers precalculus topics including trigonometric functions, trigonometric identities, graphing trigonometric functions, inverse trigonometric functions, analytic geometry including lines and conic sections, matrices and determinants, polynomial and rational functions including factoring, solving equations and inequalities, and other functions. Students are instructed to use a unit circle chart for questions involving trigonometric functions. The guide contains 47 multiple part questions testing a wide range of precalculus concepts.
This document provides instructions for a mathematics scholarship test consisting of 45 multiple-choice questions across 3 sections: Algebra, Analysis, and Geometry. The instructions specify that candidates should answer each question in the provided answer booklet rather than on the question paper. Various mathematical terms and notation are defined for reference. The questions cover a wide range of topics in higher mathematics including algebra, analysis, geometry, and complex analysis.
The document is a past exam paper for the term-end examination in Computer Oriented Numerical Techniques. It contains 6 questions testing various numerical analysis techniques including interpolation, root finding using bisection, Newton-Raphson, and Regula Falsi methods, solving differential equations using Runge-Kutta and solving systems of equations using Gauss-Jordan elimination, Jacobi and Gauss-Seidel iteration methods. Students are required to answer 4 out of the 6 questions in the paper.
This document provides instructions and problems for using a graphic display calculator to solve equations, find sums, graph functions, find derivatives and limits, solve simultaneous equations, and more. Key tasks include writing functions in different forms, finding transformations of curves, evaluating Pascal's triangle terms, expanding polynomials, finding tangents and asymptotes, and drawing inverse functions.
This document contains a practice test with multiple choice and written response questions about transformations of graphs of functions. Some key questions ask students to:
1) Identify which statement about transforming a graph is false.
2) Determine if reflecting a function's graph in the y-axis will produce its inverse.
3) Write equations of functions after transformations like translations, stretches, and reflections.
4) Sketch and describe transformations of a graph to satisfy a given equation.
5) Determine the domain and range of a transformed function.
6) Find the inverse of a function and restrict its domain to make the inverse a function.
The document provides instructions on graphing parabolas using vertex form and translations. It defines the vertex form of a parabola as y = a(x - h)2 + k, where (h, k) are the coordinates of the vertex. Examples show how to find the image of a parabola under a translation Th,k and graph parabolas by hand by determining the vertex and symmetrical y-values. Steps are given to graph a parabola as finding the vertex, symmetrical values, and filling in the graph.
This document contains a 5 page exam for the course CS-60: Foundation Course in Mathematics in Computing. The exam contains 17 multiple choice and numerical problems covering topics like algebra, calculus, matrices, and complex numbers. Students have 3 hours to complete the exam which is worth a total of 75 marks. Question 1 is compulsory, and students must attempt any 3 questions from questions 2 through 6. The use of a calculator is permitted.
Review for the Third Midterm of Math 150 B 11242014Probl.docxjoellemurphey
Review for the Third Midterm of Math 150 B 11/24/2014
Problem 1
Recall that 1
1−x =
∑∞
n=0 x
n for |x| < 1.
Find a power series representation for the following functions and state the radius of
convergence for the power series
a) f(x) = x
2
(1+x)2
.
b) f(x) = 2
1+4x2
.
c) f(x) = x
4
2−x.
d) f(x) = x
1+x2
.
e) f(x) = 1
6+x
.
f) f(x) = x
2
27−x3 .
Problem 2
Find a Taylor series with a = 0 for the given function and state the radius of conver-
gence. You may use either the direct method (definition of a Taylor series) or known
series.
a) f(x) = ln(1 + x)
b) f(x) = sin x
x
c) f(x) = x sin(3x).
Problem 3
Find the radius of convergence and interval of convergence for the series
∑∞
n=1
(x+2)n
n4n
.
Ans. Radius r=2,
√
2 − 2 < x <
√
2 + 2. Problem 4
Find the interval of convergence of the following power series. You must justify your
answers.
∑∞
n=0
n2(x+4)n
23n
.
Ans. −12 < x < 4.
Problem 5
For the function f(x) = 1/
√
x, find the fourth order Taylor polynomial with a=1.
Problem 6
A curve has the parametric equations
x = cos t, y = 1 + sin t, 0 ≤ t ≤ 2π
a) Find dy
dx
when t = π
4
.
b) Find the equation of the line tangent to the curve at t = π/4. Write it in y = mx+b
form.
c) Eliminate the parameter t to find a cartesian (x, y) equation of the curve.
d) Using (c), or otherwise identify the curve.
Problem 7
State whether the given series converges or diverges
a)
∑∞
n=0 (−1)
n+1 n22n
n!
.
b)
∑∞
n=0
n(−3)n
4n−1
.
c)
∑∞
n=1
sin n
2n2+n
.
Problem 8
1
Approximate the value of the integral
∫ 1
0
e−x
2
dx with an error no greater than 5×10⁻⁴.
Ans.
∫ 1
0
e−x
2
dx = 1 − 1
3
+ 1
5.2!
− 1
7.3!
+ ... +
(−1)n
(2n+1)n!
+ .... n ≥ 5,
for n=5
∫ 1
0
e−x
2
dx ≈ 1 − 1
3
+ 1
5.2!
− 1
7.3!
+ 1
9.4!
− 1
11.5!
≈ 0.747.
Problem 9
Find the radius of convergence for the series
∑∞
n=1
nn(x−2)2n
n!
.
Ans. R = 1√
e
.
Problem 10
Let f(x) =
∑∞
n=0
(x−1)n
n2+1
.
a) Calculate the domain of f.
b) Calculate f ′(x).
c) Calculate the domain of f ′.
Problem 11
Let f(x) =
∑∞
n=0
cos n
n!
xn.
a) Calculate the domain of f.
b) Calculate f ′(x).
c) Calculate
∫
f(x)dx.
Problem 12
Using properties of series, known Maclaurin expansions of familiar functions and their
arithmetic, calculate Maclaurin series for the following.
a) ex
2
b) sin 2x
c)
∫
x5 sin xdx
d) cos x−1
x2
e)
d((x+1) tan−1(x))
dx
Problem 13
Calculate the Taylor polynomial T5(x), expanded at a=0, for
f(x) =
∫ x
0
ln |sect + tan t|dt.
Ans. T5(x) =
x2
2
+ x
4
4!
.
Problem 14
Suppose we only consider |x| ≤ 0.8. Find the best upper bound or maximum value
you can for∣∣∣sin x − (x − x33! + x55! )∣∣∣
Same question: If
(
x − x
3
3!
+ x
5
5!
)
is used to approximate sin x for |x| ≤ 0.8. What is
the maximum error? Explain what method you are using.
Problem 15
The Taylor polynomial T5(x) of degree 5 for (4 + x)
3/2 is
(4 + x)3/2 ≈ 8 + 3x + 3
16
x2 − 1
128
x3 + 3
4096
x4 − 3
32768
x5.
a) Use this polynomial to find Taylor polynomials for (4 + ...
This document provides instructions and examples for factoring polynomial expressions using algebra tiles. It explains how to factor trinomials by finding the greatest common factor, identifying the product of the first and last terms, making a T-table to list all factors of that product, and using the box method to group the factors. Several examples are worked through step-by-step and a multiple choice question is presented with the full solution shown. Warm-up exercises are also provided for students to practice factoring trinomial expressions.
This document contains sample answers and solutions to exercises in a math textbook. It includes:
1) Answers to standard form exercises and diagnostic tests in Chapter 1.
2) Answers to quadratic expressions exercises and diagnostic tests in Chapter 2.
3) Answers to sets exercises and diagnostic tests in Chapter 3.
4) Sample exercises and answers on mathematical reasoning in Chapter 4.
5) Sample exercises and answers on straight lines in Chapter 5.
The document provides concise worked out solutions to math problems across multiple chapters in a standardized format for student practice and review.
The document contains 10 problems involving calculating angles between lines and planes in 3-dimensional space. Specifically, it contains:
1) Problems calculating angles between lines and planes in pyramids and cuboids.
2) A diagnostic test with 10 multiple choice questions assessing the ability to name and calculate angles between lines and planes in various 3D shapes.
3) The document provides practice for understanding lines and planes in 3D geometry, particularly as it relates to pyramids, cuboids, and calculating angles between geometric elements in 3-dimensional space.
1. This document contains 10 exercises with multiple choice questions about calculating angles of elevation and depression based on diagrams showing vertical poles, towers, and other structures. The questions require applying trigonometric concepts like tangent, inverse tangent, and inverse sine to determine unknown angles and distances.
2. Exercise 1 contains 8 practice problems for students to work through. These cover topics like finding the angle of elevation from an observer to an object above them, using angles of elevation to calculate distances between points on vertical structures, and more.
3. Exercise 2 has 10 additional practice problems testing similar concepts to Exercise 1, focusing on calculating heights, distances, and angles using information about the angles of elevation/depression and other given
The document contains two chapters and exercises related to trigonometry. Chapter 9 covers trigonometry II and contains definitions and properties of trigonometric functions. The exercises contain 10 multiple choice questions related to calculating trigonometric functions like sine, cosine and tangent from diagrams and using trigonometric identities and inverse functions.
1. The document contains practice problems about finding unknown angle measures in diagrams with circles and tangent lines. There are multiple exercises with 10 problems each, focusing on using properties of tangents, radii, and angles to find values like x, y, or other angle measures.
2. Key concepts covered include common tangents to multiple circles, relationships between an angle at the circumference and the angle inscribed by the tangent, and using properties of circles like diameters.
3. Students must apply properties of circles and tangents to analyze the geometric diagrams and choose the correct measure for variables like x, y, or an angle based on the information given.
1. A document contains sample probability questions and answers about events such as rolling dice, picking cards or balls from boxes, coin tosses, and surveys.
2. The questions ask students to determine the sample space of events, calculate probabilities of outcomes, predict expected numbers of outcomes, and solve for unknown values.
3. The answers provided include writing out sample space elements, listing outcomes, calculating probabilities as fractions or decimals, and finding values that satisfy given probability equations.
The document provides examples and exercises on statistics concepts like mean, median, mode, range, class intervals, frequency distributions, and pictographs. It contains 10 questions with multiple parts testing understanding of these concepts through calculations and interpreting data presented in tables and diagrams.
This document contains 10 multi-part math word problems involving straight lines. The problems ask students to determine gradients, equations, intercepts, and coordinates from diagrams showing straight lines and geometric shapes like triangles, parallelograms, and perpendicular lines. Students must use properties of parallel and perpendicular lines as well as the slope-intercept form of a line to analyze the diagrams and solve the multi-step problems.
1. The document presents an exercise on mathematical reasoning with 5 questions.
2. The questions test a variety of mathematical logic skills, including determining if statements are true or false, writing implications, completing arguments with valid premises, and using quantifiers to form true statements.
3. The final section provides a diagnostic test to further assess skills in mathematical statements, implications, argument structures, and applying properties of shapes and numbers.
The document contains examples and exercises on sets and Venn diagrams. It includes questions that ask the reader to:
1) Shade regions in Venn diagrams that represent given sets;
2) Find the number of elements in sets defined within Venn diagrams;
3) List elements that are the intersection or union of given sets; and
4) Draw additional sets in incomplete Venn diagrams based on defined conditions.
The document contains examples and exercises on quadratic expressions and equations. It includes expanding expressions, factorizing expressions, solving quadratic equations, and word problems involving quadratic equations. The exercises cover a range of skills related to quadratic expressions and equations.
The document provides examples and exercises on standard form and rounding numbers to significant figures. It includes rounding numbers, expressing numbers in standard form, evaluating expressions in standard form, and calculating the mass of a carbon dioxide molecule. The diagnostic test at the end contains 10 multiple choice questions testing concepts related to standard form and significant figures.
The document discusses probability and provides examples and solutions. It defines probability as the number of favorable outcomes divided by the total number of possible outcomes. It gives examples of calculating probabilities of events such as choosing balls of different colors from a bag. It also discusses combined events and finding probabilities of "or" and "and" events.
The document contains 10 multi-part math problems involving calculations on a spherical earth model. The problems involve finding locations, distances, speeds, and times for journeys between points on parallels of latitude and along meridians of longitude. The answers provided give the numerical solutions to each part of the problems in a standardized format.
The document contains 5 math problems involving calculating volumes of 3D shapes:
1. Finding the height of a cone joined to a cylinder given the volumes is 231 cm^3.
2. Calculating the volume of a solid cone with a cylinder removed.
3. Finding the volume of a cylinder with a hemispherical section removed.
4. Determining the volume of a solid formed by joining a cone and hemisphere.
5. Calculating the volume of a container made of a cuboid and a cylindrical quadrant.
1. A solid right prism with a rectangular base is shown. Plans and elevations are drawn to scale of the prism and when combined with a solid cuboid.
2. A solid with a cuboid and half cylinder joined is shown. Plans and elevations are drawn to scale of the solid and when combined with a solid right prism.
3. A solid consisting of a right prism and half cylinder is shown. Plans and elevations are drawn to scale.
4. A solid right prism is shown. Plans and elevations are drawn to scale of the prism and when combined with a solid cuboid.
5. A solid right prism with trapez
The document contains sample questions and solutions for understanding concepts related to distance-time graphs and speed-time graphs. It introduces key ideas such as calculating speed from the gradient of a distance-time graph, calculating average speed and acceleration from areas under graphs, and using graphs to solve word problems about distance, speed, and time for moving objects. Several practice exercises with multiple choice and short answer questions are provided to help students apply these graph-based concepts.
Here are the key steps to solve quadratic equations:
1. Factorize the quadratic expression if possible. This allows using the zero product property.
2. Use the quadratic formula if factorizing is not possible:
x = (-b ± √(b^2 - 4ac)) / 2a
3. Solve for the roots. The roots are the values of x that make the quadratic equation equal to 0.
4. Check your solutions in the original equation to verify they are correct roots.
5. Determine the nature of the roots:
- If the discriminant (b^2 - 4ac) is greater than 0, there are two real distinct roots.
- If the discriminant
1) Bearings are defined as the angle measured clockwise from north to the straight line between two points.
2) Examples of bearings are shown between points P and Q, with the bearing of Q from P measured as the angle from north to the line PQ.
3) An exercise asks the reader to draw diagrams showing the direction of Q relative to P for different given bearings, and to state the bearings of P from Q and Q from P based on the diagrams.
The document contains instructions and diagrams for 6 mathematics problems involving plans and elevations of 3D shapes. Students are asked to draw the plans and elevations of prisms, combined prisms, and prisms with half-cylinders attached. The problems involve multiple steps of interpreting diagrams, identifying corresponding sides between views, and drawing the views to scale.
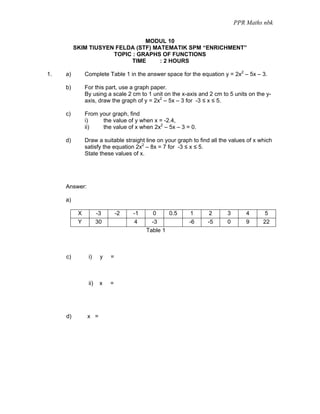
1. PPR Maths nbk
MODUL 10
SKIM TIUSYEN FELDA (STF) MATEMATIK SPM “ENRICHMENT”
TOPIC : GRAPHS OF FUNCTIONS
TIME : 2 HOURS
1. a) Complete Table 1 in the answer space for the equation y = 2x2 – 5x – 3.
b) For this part, use a graph paper.
By using a scale 2 cm to 1 unit on the x-axis and 2 cm to 5 units on the y-
axis, draw the graph of y = 2x2 – 5x – 3 for -3 ≤ x ≤ 5.
c) From your graph, find
i) the value of y when x = -2.4,
ii) the value of x when 2x2 – 5x – 3 = 0.
d) Draw a suitable straight line on your graph to find all the values of x which
satisfy the equation 2x2 – 8x = 7 for -3 ≤ x ≤ 5.
State these values of x.
Answer:
a)
X -3 -2 -1 0 0.5 1 2 3 4 5
Y 30 4 -3 -6 -5 0 9 22
Table 1
c) i) y =
ii) x =
d) x =
2. PPR Maths nbk
2. a) Complete Table 2 in the answer space for the equation y = x2 – 5x + 4.
b) For this part, use a graph paper.
By using a scale 2 cm to 1 unit on the x-axis and 2 cm to 5 units on the y-
axis, draw the graph of y = x2 – 5x + 4 for 0 ≤ x ≤ 8.
c) From your graph, find
a. the value of y when x = 4.5,
b. the value of x when y = 21.75
d) Draw a suitable straight line on your graph to find all the values of x which
satisfy the equation x2 – 7x + 3 = 0 for 0 ≤ x ≤ 8.
State these values of x.
Answer:
a)
X 0 1 2 2.5 3 4 5 6 7 8
Y 4 0 -2 -2 4 10 18 28
Table 2
c) i) y =
ii) x =
d) x =
3. PPR Maths nbk
5
3. a) Complete Table 3 in the answer space for the equation y = .
x
b) For this part, use a graph paper.
By using a scale 2 cm to 1 unit on the x-axis and 2 cm to 2 units on the
5
y-axis, draw the graph of y = for -5 ≤ x ≤ 5.
x
c) From your graph, find
a. the value of y when x = 1.8,
b. the value of x when y = -6.
d) From your graph, find all the values of x with the condition that the value
of y is three times the value of x.
Answer:
a)
X -5 -3 -2 -1 -0.5 0.5 0.9 1.5 2.5 5
Y -1 -1.7 -2.5 -10 10 5.6 3.3 1
Table 3
c) i) y =
ii) x =
d) x =
4. PPR Maths nbk
2
4. a) Complete Table 4 in the answer space for the equation y =
x
b) For this part, use a graph paper.
By using a scale 2 cm to 1 unit on the x-axis and 2 cm to 1 units on the y-
2
axis, draw the graph of y = for -4 ≤ x ≤ 4.
x
c) From your graph, find
a. the value of y when x = -1.5,
b. the value of x when y = 1.2.
d) Draw a suitable straight line on your graph to find all the values of x which
2 3
satisfy the equation = x - 2 for -4 ≤ x ≤ 4.
x 4
State these values of x.
Answer:
a)
X -4 -2.5 -2 -1 -0.5 0.5 1 2 2.5 4
Y -0.5 -0.8 -2 -4 4 2 1 0.5
Table 4
c) i) y =
ii) x =
d) x =
5. PPR Maths nbk
5. a) Complete Table 5 in the answer space for the equation
y = x3 – 13x + 18 .
b) For this part, use a graph paper.
By using a scale 2 cm to 1 unit on the x-axis and 2 cm to 5 units on the y-
axis, draw the graph of y = x3 – 13x + 18 for -4 ≤ x ≤ 4.
c) From your graph, find
a. the value of y when x = -1.5,
b. the value of x when y = 25.
d) Draw a suitable straight line on your graph to find all the values of x which
satisfy the equation x3 – 11x – 2 = 0 for -4 ≤ x ≤ 4.
State these values of x.
Answer:
a)
X -4 -3 -2 -1 0 1 2 3 4
Y 6 36 30 18 6 6 30
Table 5
c) i) y =
ii) x =
d) x =
6. PPR Maths nbk
6. a) Complete Table 6 in the answer space for the equation
y = x3 + x2 – 12x – 5.
b) For this part, use a graph paper.
By using a scale 2 cm to 1 unit on the x-axis and 2 cm to 5 units on the y-
axis, draw the graph of y = x3 + x2 – 12x – 5 for -4 ≤ x ≤ 4.
c) From your graph, find
a. the value of y when x = 0.5,
b. the value of x when 11.9.
d) Draw a suitable straight line on your graph to find all the values of x which
satisfy the equation x3 + x2 – 10x = 0 for -4 ≤ x ≤ 4.
State these values of x.
Answer:
a)
X -4 -3 -2 -1 0 1 2 3 4
Y -5 13 7 -5 -15 -17 27
Table 6
c) i) y =
ii) x =
d) x =
7. PPR Maths nbk
MODULE 10 – ANSWERS
TOPIC: GRAPHS OF FUNCTIONS
1. a) x=-2 y=15 x=0.5 y= -5 x=3 y=0
b) graph
40
35
30
25
y(x) = 2⋅x2-5⋅x-3
20.5
20
15
y(x) = 3⋅x+4
10
5
-10 -5 5 10
-2.4 -0.75 4.75
-5
-10
c) i) x=-2.4 y= 20.5
ii) when 2x2 – 5x – 3 = 0
y=0
Then the values of x is -0.5 and 3
e) y=2x2-5x-3
0=2x2-8x-7 (-)
-----------------------
Y= 3x + 4
X 0 3
Y 4 13
From the graph x= -0.75 and 4.75
8. PPR Maths nbk
2. a)x=2.5 y=-2.25 x=4 y=0
b)graph 2
c) i) y=1.75
ii) x=7.4
e) straight line y=2x+1
x=0.45 and 6.55
3. a) x=-1 y=-5 x=2.5 y=2
b)graph
16
C
14
12
10
y(x) = 3⋅x
8
6
4
2
A
-5 -4 -3 -2 -1 1 2 3 4 5
B
-2
5
y(x) =
x -4
-6
-8
-10
-12
-14
c) i) x=1.8 y= 2.8
ii) y=-6 x=-0.8
e) The graph is y=3x
X 0 2
Y 0 6
The values of x= -1.3 and 1.3
9. PPR Maths nbk
4. a) x=-2 y=-1 x=2.5 y=0.8
b) graph
c) i) y=-1.3
ii) x=1.7
3
e) The straight line is y= x–2
4
The values of x = -0.75 and 3.45
5. a) x=-3 y=30 x=2 y=0
b) graph 45
40
35 34
30
y=x^3-1 3x+18
25
20
y=-2x+20
15
10
5
3.85
-3.2
-0.25
-6 -4 -2 2 3.35 4 6
c) i) x=-1.5 y=34 -5
ii) y=25 x=3.85
e) y=x3-13x+18
0=x3-11x-2 (-)
--------------------------
Y= -2x+20
X 0 4
Y 20 12
10. PPR Maths nbk
X= -3.2, -0.25 and 3.35
6. a) x=-2 y=15 x=3 y=-5
b) graph 6
c) i) y=10.75
ii) x=-1.5
e) y=-12x-5
x=-3.6, 0 and 2.75