Late Summer US Inflation Spike Ends, Deflation Expectations NosediveEd Dolan
The late-summer spike in US CPI inflation ended in October. Deflation expectations fell sharply after the November election, and inflation expectations remain low
U.S. Inflation Indicators Come in Below Target as the Global Economy Begins t...Ed Dolan
The document summarizes US inflation data for December 2012. It reports that the headline CPI showed little change, core inflation slowed slightly to 1.8%, and trimmed mean inflation remained moderate at 1.5%. All three major inflation indicators remained below the Fed's implicit 2% inflation target for December. The document also notes that economists look at core and trimmed mean inflation to judge underlying trends, and that longer-term year-over-year inflation rates are beginning to fall again.
Gasoline Pushes US Inflation Higher in AugustEd Dolan
The document summarizes inflation data from the August 2012 Consumer Price Index report. It notes that while headline inflation spiked to 7.44% due to a rise in gasoline prices, core inflation fell to 0.6%. The trimmed mean inflation rate also remained low at 2%. The document discusses how economists look at various inflation measures and the Federal Reserve's 2% inflation target when making monetary policy decisions like quantitative easing.
US Inflation Data: Seasonally Adjusted CPI Shows Zero Change in AprilEd Dolan
US inflation, as measured by the seasonally adjusted consumer price index for all items, fell to zero in April. Other measures showed inflation at low but positive rate.
All Major US Inflation Indicators Fall Below Fed Targets in MayEd Dolan
The document summarizes US inflation data from May 2012. It discusses that the headline CPI fell 0.3% in May, representing the sharpest annual decrease since 2008. Core inflation, which excludes food and energy prices, slowed sharply due to a over 4% monthly drop in energy prices and 6% decline in gasoline prices. The trimmed mean CPI, which removes the most and least increased prices, also fell sharply in May. All of the inflation measures discussed were below the Fed's 2% target rate for prudent monetary policy.
Latest GDP Revisions Carry Mixed Message for ElectionsEd Dolan
The document summarizes an economics blog post analyzing the latest revision to US GDP growth figures for Q2 2012. It notes that real GDP growth was revised down to 1.3%, the slowest since 2011. While the economy continued its expansion, consumption growth was modest and government spending declines slowed. Profits remained high even as nominal GDP growth slowed. The data provides mixed messages for the upcoming presidential election by suggesting both economic weakness overall but strength in corporate profits.
Consumer prices in the US rose 1.4% in January compared to a year ago, showing signs of accelerating inflation. While rising costs for housing and healthcare were offset by lower oil prices, core inflation excluding food and energy rose 0.3% for the month and 2.2% over the last year. The Federal Reserve is monitoring inflation closely as it aims for a target of 2% annual inflation. While lower gas prices and a strong dollar have kept inflation down, housing costs continue to rise steadily. The report suggests inflation may be picking up gradually in line with the Fed's goals.
GDP Growth Remains Slow in Q1 2012, Corporate Profits FallEd Dolan
US GDP growth slowed to 1.9% in Q1 2012, down from 3% in Q4 2011, marking the 11th consecutive quarter of growth but also a slowing recovery. Consumption and investment contributed most to growth while government spending continued to decline. Corporate profits declined for the first time since 2008 due to a decrease in foreign profits offsetting domestic growth as the world economy slowed. The nominal GDP gap remains large compared to potential growth targets.
US Job Growth Weak in June, Unemployment Holds SteadyEd Dolan
The U.S. job market remained weak in June with an addition of only 80,000 jobs, little changed from the previous months. While the private sector added 84,000 jobs, this was offset by a loss of 4,000 government jobs. The unemployment rate held steady at 8.2% as the labor force increased slightly. The percentage of long-term unemployed (those unemployed for 27 weeks or longer) declined slightly but remains elevated.
US Employment Data: Strong Jobs Report Leads Off the Election SeasonEd Dolan
US payroll jobs grew by 200,000 in December and the unemployment rate fell to its lowest level since February 2009, leading off an election season that will focus on jobs, jobs, jobs!
Lawrence Yun's Economic and Housing Market UpdateNAR Research
The document discusses the state of the US housing and economic markets. It notes that pending home sales are rising but appraisal issues are slowing down closings. The slowing housing market is impacting the economic recovery. It forecasts a slow economic recovery with GDP growth around 1.5% in 2010 and unemployment remaining high at 10%. It recommends extending and expanding the home buyer tax credit to help stabilize home values and reduce foreclosures.
Job growth in the US slowed again in June, with only 18,000 total payroll jobs added. Private sector job growth of 57,000 was offset by a loss of 39,000 government jobs. The unemployment rate edged up to 9.2%, its highest since December 2010, as 173,000 more people became unemployed. The labor force also shrank by 272,000 as discouraged workers stopped looking for jobs. A broader unemployment rate (U-6) includes those who are underemployed or marginally attached to the workforce. The employment to population ratio equaled its lowest level during the recession at 52.8%, reflecting slow job growth and more people dropping out of the workforce.
How Chronic Budget Optimism Helped Dig The Hole We Are InEd Dolan
The document summarizes key points from Ed Dolan's economics blog about chronic overoptimism in US budget projections. It notes that budget projections routinely overestimated GDP growth and underestimated unemployment, contributing to growing budget deficits. As a result, tax cuts and unfunded spending increases were harder to justify and the national debt may be higher than if more cautious assumptions had been used. The President acknowledged the FY2012 budget does not do enough to restore fiscal health.
This document contains notes from an economics class lecture on inflation. It defines inflation as a general rise in prices rather than a rise in value. It discusses how economists use price indexes like the Consumer Price Index to measure inflation. It then outlines several theories of what causes inflation, such as too much money in the economy (quantity theory) or increases in production costs (cost-push theory). It also describes some effects of inflation like erosion of purchasing power and profits from interest.
Growth Potential and Headwinds for New Home Construction examines factors influencing new home construction in the United States. While overall housing recovery is occurring, single-family home construction continues to lag due to relatively weak demand and supply constraints limiting inventory. On the demand side, rental housing leads as fewer millennials get married or buy first homes. Supply is restricted by shortages in labor, lots, and lending for builders. Material prices are also rising. Forecasts predict a continued recovery in multifamily building and a normalization of total housing starts by the second half of the decade as the population in prime household formation years increases.
Inflation about to become a massive headache for central bankersgloriasimmon
The document discusses concerns about rising inflation from monetary policy actions taken by central banks like the Federal Reserve and Bank of England. While inflation has been low since the 1970s, easy monetary policies for extended periods risk wage inflation becoming embedded in the economy, which is very difficult to reduce. The Bank of England faces this dilemma as inflation forecasts are rising even as economic growth remains weak. The author worries the Federal Reserve may ignore inflation risks in trying to spur job growth through monetary actions.
October Job Growth Still Slow but Better News in the DetailsEd Dolan
- US job growth in October was slow at 80,000 new private sector jobs, though revisions showed stronger growth of 57,000 and 104,000 in prior months.
- The unemployment rate dropped slightly to 9.0% as 140,000 new jobs were reported in a household survey, though the labor force also grew.
- A broader measure of unemployment that includes those who want to work but are not actively looking fell to 16.2% as fewer people reported being in forced part-time work.
- The employment-population ratio ticked up slightly but remains near historic lows, reflecting slow job growth and more workers dropping out of the labor force.
Lecture 5 - Finance for Micro-Renewable ProfessionalsJohn Clarkson
This is part of my new UDEMY course on Micro-Renewable energy. If you are interested please contact me for more details. Here you will learn to sell micro-renewable energy using metrics from capital budgeting rather than payback times which are generally off putting to anyone who is in the know.
The document discusses federal spending from 2000 to 2010. It shows that total government expenditures doubled during this ten-year period, representing a 93% increase. By analyzing the data, the document determines that on average, the federal budget grew by slightly over 6% each year over this time period. This example demonstrates the power of compound growth and how spending can double relatively quickly at an annual growth rate below 10%.
Consumer spending and its impact on the economyJonathan
Consumer spending is determined by five key factors: disposable income, income per capita, income inequality, household debt levels, and consumer confidence. Disposable income, or income after taxes, is the most important determinant, as it determines how much people have available to spend. When disposable income rises, consumer demand and economic expansion increase as well. Income inequality also impacts spending, as increases concentrated among low-income groups are spent on necessities, boosting the economy more than increases concentrated among high earners. High household debt levels and lack of consumer confidence can constrain spending.
This document summarizes questions and responses from a dialogue between the National Rural Electric Cooperative Association and consumers about the future of energy and climate change legislation. It addresses questions about the potential impacts of EPA regulation of power plant emissions, the effects of errors in climate change reports, the likelihood that cap and trade systems remain part of legislation, costs to consumers, the role of nuclear power, and the effects of healthcare debates on climate change legislation.
According to data from the Energy Information Administration's Short-Term Energy Outlook, the average cost of diesel fuel in 2009 was $2.46 per gallon. Their estimate for the average cost of diesel fuel in 2010 is $2.84 per gallon, representing an estimated fuel inflation rate of 15.44% over 2009 prices. The data was prepared by Michael Hudson from the cited source and contact information.
This document provides an introduction to economic indicators for journalism students. It defines economic indicators as data used to evaluate the health of an economy and gives examples like the Consumer Price Index. It describes different types of indicators such as lagging, coincident, and leading indicators. The document discusses qualities of a good indicator and past student examples. It also notes that indicators should be original, measure an important activity accurately, and correlate with broader economic measures.
US CPI Inflation Remains Near Zero as Sequester LoomsEd Dolan
The document summarizes a blog post about US inflation rates in November 2012. It discusses that the overall CPI fell 3.7% annually due to lower energy prices. The core inflation rate, which excludes food and energy, fell to 1.33% annually. The trimmed mean CPI, which excludes outliers, slowed to 1.64% annually. All measures of inflation were below the Fed's 2% target rate. Inflation expectations also remained below the Fed's targets.
US GDP Growth Revised Downward on Falling ExportsEd Dolan
The US Bureau of Economic Analysis revised US GDP growth in the first quarter of 2013 down to 1.8% from the previous estimate of 2.4%. This represents a slower rate of growth than the previous quarter. Exports declined for the second consecutive quarter as the global economy slowed, while government spending cuts continued to drag on overall growth, referred to as "fiscal drag". Consumption remained the largest contributor to growth.
Banks may take excessive risks due to contagion effects, moral hazard, and agency problems. Contagion effects can cause bank failures to spread from one bank to others. Moral hazard arises from deposit insurance which can encourage banks to take greater risks. Agency problems occur when bank executives are incentivized to pursue high risk strategies that benefit themselves rather than shareholders and depositors. These issues suggest banks may require regulation to limit their risk-taking.
This document discusses key economic indicators like inflation and unemployment. It defines inflation, lists common inflation measures like the CPI and PPI, and outlines drawbacks of the CPI. Unemployment is defined as those without a job but seeking work. Common types of unemployment include frictional, structural, and cyclical. Factors like minimum wages and recessions can impact unemployment levels.
1) The document discusses why economists fear deflation, noting that sustained deflation can interfere with the smooth operation of the economy.
2) Deflation becomes problematic when nominal interest rates hit 0%, as further deflation causes real interest rates to rise, discouraging borrowing and economic activity. Unexpected deflation can also cause losses for banks by reducing the value of loans and collateral.
3) Deflation limits the effectiveness of monetary policy tools like interest rate cuts once rates hit 0%, and alternative tools like quantitative easing have had mixed results in stimulating economies.
4) Deflation also creates challenges for labor markets, as workers resist nominal wage cuts even if they only match falling prices, which can lead to higher
Inflation increased slightly in January according to several key measures. Consumer prices rose 0.2% while producer prices increased 0.1%. Both measures show prices are noticeably higher than a year ago. Core consumer prices, excluding food and energy, are just outside the target range of 1-2%. Some items like meats, food, transportation and medical costs are rising at a considerable rate causing concern. The Federal Reserve has committed to keeping interest rates low through late 2014 to help the economy, though this policy could lead to higher inflation.
This document discusses inflation and deflation, including how they are defined and measured. It explains that inflation is a persistent increase in prices, while deflation is a persistent decrease in prices. Inflation is measured using the Consumer Price Index (CPI), which tracks the prices of goods and services in an average consumer's basket. Calculating the CPI involves selecting consumer goods, surveying prices each month, and using a formula to determine changes in the overall price level compared to a base period. High and unpredictable inflation can negatively impact economies by redistributing wealth and lowering production.
In the Inflation Watch series, NAR Research focuses on the price level. We monitor measures of inflation that affect the business of REALTORS® and summarize their impact, highlighting areas of potential concern.
This document discusses different types of inflation. It defines inflation as a general rise in prices over time. Inflation can be categorized based on its degree of control, rate of employment, or causes. The main types discussed are demand-pull inflation, cost-push inflation, and markup inflation. Demand-pull inflation occurs when demand increases faster than supply, leading sellers to raise prices. Cost-push inflation happens when costs of production rise, forcing companies to pass those costs to consumers through higher prices. Markup inflation involves companies and workers increasing prices to maintain profit margins.
- Inflation remained moderate in November with overall prices flat, but prices are still noticeably higher than a year ago.
- Some prices like food, transportation and medical services are rising at concerning rates.
- The Federal Reserve will likely continue its low interest rate policy through mid-2013 to support economic growth, though this could increase inflation risks.
In the Inflation Watch series, NAR Research focuses on the price level. We monitor measures of inflation that affect the business of REALTORS® and summarize their impact, highlighting areas of potential concern.
- Inflation moderated or declined in October for measures like the consumer price index, gold prices, and producer price indexes, though prices remain higher than a year ago.
- While overall and core consumer prices remain within the Fed's target range of 1-2% and 2-4% respectively, they are approaching the upper bounds.
- The relaxation in price growth in October means the Fed will likely continue its low-rate policy committed through mid-2013.
Daily Economic Update for December 14, 2010NAR Research
The producer price index increased in November for all finished goods and core goods excluding food and energy. Prices of core finished goods have increased between 0.5-2% annually for the past 13 months, below the 10-year average, but rising intermediate and crude goods prices suggest inflation over deflation in the coming year. Retail sales were strong in November, especially for general merchandise, sporting goods, books, music, and clothing as holiday shopping began. The Federal Reserve held interest rates near zero and will continue purchasing $600 billion in Treasury securities to balance inflation and deflation risks.
Using cartoons to teach about inflationMike Fladlien
This document provides a summary of several cartoons that use humor and metaphor to explain concepts related to inflation. It discusses topics like the components that make up the Consumer Price Index, the effects of drought on food prices, how higher gas prices can slow economic recovery, and how monetary and fiscal policy tools like interest rates and tax cuts can be used to combat inflation. The document also examines more complex issues like cost-push inflation, the distributional impacts of inflation on debtors and creditors, and the risks of hyperinflation.
This document provides an overview of inflation and how it is measured. It discusses what inflation is, how it is defined and measured through indexes like the CPI. It outlines some of the key causes of inflation like demand-pull and cost-push factors. It also discusses how inflation affects different groups like creditors, debtors and those on fixed incomes. The document explains how central banks like the Federal Reserve use interest rates to try and control inflation.
The document discusses various measures of inflation and cost of living. The consumer price index (CPI) measures the cost of typical household purchases and is used to track inflation. However, the CPI has limitations and may overstate inflation by about 1% annually due to substitution effects, new products, and unmeasured quality changes. The GDP deflator similarly measures price changes but for all goods and services produced rather than consumed. Price indexes are necessary to correct dollar amounts for inflation when making comparisons over time or calculating real interest rates.
Inflation is important for real estate agents because it can influence interest rate policy set by the Federal Reserve. The Fed typically lowers rates to stimulate the economy but higher rates may be used to combat inflation. This document discusses recent inflation trends, including rising producer and energy prices beginning to impact consumer prices. There is an expectation among economists of further price and cost increases. Some fear that high inflation or stagflation, with high unemployment and inflation, could occur.
Inflation - How it's measured content slideshow. Designed for the Economic A level qualification. Can be used in revision and in class.
Subtopics:
Intro to Inflation
Index Figures, Measuring Inflation
The CPI
RPI: An Alternative Measure of Inflation
This document discusses the importance of reuploading revised versions of slideshows on Slideshare without changing the URL. It allows for short-term error corrections, long-term revisions to keep content up to date, and for classroom materials to link to the latest version. Although Slideshare removed the reupload feature, users can request its return by searching for "Reupload" on the support page and asking them to bring it back due to its value. The document encourages users to submit feedback to potentially have the feature restored if there is widespread demand.
The document discusses the concept of the Non-Accelerating Inflation Rate of Unemployment (Nairu). The Nairu represents the lowest level of unemployment an economy can sustain before wages and prices begin to rapidly increase. It captures both parts of the Federal Reserve's dual mandate to achieve maximum employment and price stability. However, estimating the precise Nairu is difficult because the relationship between unemployment and inflation has changed over time and the Phillips Curve is no longer stable. Nonetheless, the Federal Reserve monitors unemployment relative to estimates of the Nairu when making decisions around interest rates and monetary policy.
How Liberals and Conservatives Can Talk About Climate changeEd Dolan
Many liberals are afraid to talk to their conservative friends and neighbors about climate change. They think it is a waste of time and that all conservatives are climate deniers. Their conservative friends have similar feelings about liberals. Here is why liberals and conservatives should talk to each other about climate and how a constructive dialog is possible.
This document provides a tutorial on consumer and producer surplus. It explains that the demand curve represents how much consumers will buy at different prices or the maximum consumers will pay for each unit. Consumer surplus is the difference between what consumers actually pay and the maximum they would have paid, which is the area under the demand curve above the market price. The supply curve represents the minimum price producers will accept to supply each unit or their marginal costs. Producer surplus is the difference between the revenue earned and total costs, which is the area above the supply curve but below the market price. The combined consumer and producer surplus represents the total gains from trade.
US GDP Grows at 5 Percent in Q3 2014, Best of RecoveryEd Dolan
The US GDP grew at an annual rate of 5% in the third quarter of 2014, the fastest growth of the economic recovery. This is an upward revision from the previous estimate of 3.9% growth and follows 4.6% growth in the second quarter. Strong growth was seen in consumption, investment, and exports. By the third quarter, inflation and unemployment rates were close to the targets set by the Federal Reserve, indicating the economy was approaching full recovery.
The Economics of a Price-Smoothing Oil TaxEd Dolan
An oil importing country can protect itself from the adverse effects of price volatility and encourage energy conservation by implementing a tax that varies inversely with the global oil price, thereby smoothing the domestic price.
Government agencies reported US GDP growth at a 3.6 percent in Q3. The economy added 203,000 jobs in November and unemployment fell to 7 percent, a new low for the recovery
US Adds 204,000 Jobs in October Despite ShutdownEd Dolan
The US added 204,000 new jobs in October. The unemployment rate edged up by less than a tenth of a percent. The data were muddled by the government shutdown
Breakup of the Ruble Area: Lessons for the EuroEd Dolan
After the Soviet Union was dissolved, the 15 successor states for a time shared the ruble as their common currency. The breakup of the ruble area holds lessons for the euro.
US Labor Market Shows Moderate Gains in MayEd Dolan
The US labor market continued moderate improvement in May. 175,000 new payroll jobs were added, mostly in the service sector, while the unemployment rate rose slightly. The broader U6 unemployment rate matching its low for the recovery at 13.8%. Involuntary part-time work and long-term unemployment continued gradual declines. Job growth estimates for February and March were revised upward.
US Unemployment Rate falls to 7.5 percent in April; Job Gains Revised UpEd Dolan
The US unemployment rate fell to 7.5 percent in April, a new low for the recovery. Payroll jobs increased by 165,000 and job gains for earlier months were revised upward
India’s Strategic Blueprint for Economic Growth.pdfRaj Kumble
This presentation highlights the key elements of India’s Union Budget for 2025, which aims to set the country on a path of sustainable economic growth. The budget's major areas of focus include tax relief for the middle class, substantial investments in infrastructure, job creation, and significant support for research and development. The budget also introduces targeted measures to strengthen India’s maritime and MRO sectors, ensuring long-term global competitiveness. Abhay Bhutada’s endorsement underscores the transformative potential of these initiatives, particularly in promoting inclusive growth.
Summary
• The IER estimates real GDP growth at 3.5% in 2024. According to the current IER forecast, real
GDP will grow by 2.9% in 2025 and 3.2% in 2026.
• According to the IER, real GDP grew by 2.0% yoy in January (by 1.6% yoy in December).
• In early February, power outages began for industry and businesses during peak hours due to
russian attacks on energy infrastructure.
• Naftogaz began importing gas due to a cold snap, the suspension of russian gas transit to the
EU, and shelling of gas infrastructure.
• In January, Ukraine exported 6.6 m t of goods by sea and 14 m t by rail.
• There was a seasonal decline in imports and a slowdown in exports in January.
• In January, the government received EUR 3 bn from the EU under the ERA (Extraordinary
Revenue Acceleration) mechanism, which should be repaid from profits from russian assets
frozen in the EU.
• In January, consumer inflation in annual terms further accelerated and reached 12.9% yoy.
• The NBU raised the rate from 13.5% to 14.5% per annum due to further acceleration in inflation
and deterioration in inflation expectations.
• The NBU's international reserves amounted to USD 43 bn at the end of January, which is slightly
less than USD 43.8 bn at the beginning of the year.
Tran Quoc Bao: First Vietnamese Leader on the Advisory Panel of Asian Hospita...Ignite Capital
Tran Quoc Bao: Shaping Vietnam’s Healthcare Future with Visionary Leadership and Financial Expertise
Tran Quoc Bao, CEO of Prima Saigon, stands at the forefront of transforming healthcare in Vietnam and beyond. As the leader of Prima Saigon, the country’s premier international daycare and ambulatory hospital, Bao has set new benchmarks for medical excellence and innovation. His strategic vision has propelled Prima Saigon into becoming a beacon of quality healthcare, positioning the institution at the forefront of global healthcare trends.
Beyond his success in leading Prima Saigon, Bao serves as an Advisor Member for Asian Healthcare & Hospital Management, a prominent publication that shapes healthcare policy worldwide. His work is not limited to just local impact but extends to global healthcare trends, influencing policy and operational standards across the sector.
With nearly two decades of experience, Bao has carved out a unique space where healthcare administration meets investment strategy. His career spans key positions at some of Vietnam’s leading healthcare institutions, including City International Hospital, FV Hospital, TMMC Healthcare, and Cao Tang Hospital, along with international expertise at The Alfred Hospital in Australia. A pioneer in internationalizing Vietnam’s healthcare sector, Bao led the transformation of Cao Tang Hospital into the country’s first Joint Commission International (JCI)-accredited facility, marking a milestone for Vietnam’s healthcare system on the global stage.
Bao’s expertise goes beyond healthcare management. Armed with prestigious credentials—including CFA®, CMT®, CPWA®, and FMVA®—he has driven over $2 billion in healthcare mergers and acquisitions, reshaping Vietnam’s healthcare investment landscape. His ability to combine healthcare innovation with financial strategy has earned him recognition as a thought leader in the sector.
A prolific contributor to global discussions on healthcare investment, Bao has written for major publications like Bloomberg, Forbes, US News, and Voice of America, further cementing his status as a respected authority. His numerous accolades include Healthcare Executive of the Year by the Malaysia Health Tourism Council in 2021 and recognition as a “Doing Business 2022” leader by the World Bank Group.
Additionally, Bao’s expertise is in demand by consulting powerhouses like BCG, Bain, and McKinsey, where he has advised on some of the most strategic healthcare investments and partnerships in Asia. With his unparalleled leadership and forward-thinking vision, Bao continues to shape the future of healthcare across the globe, ensuring that Vietnam’s healthcare system remains competitive and internationally recognized.
INDUSTRIAL ESTATES IN TAMIL NADU by Dr. S. MaliniMaliniHariraj
Tamil Nadu is a leading industrial hub in India, attracting foreign investment due to its strong infrastructure, logistics, and diverse manufacturing sector, including automobiles, aerospace, pharmaceuticals, textiles, electronics, and chemicals. The state has the second-highest GDP in India and houses the largest number of factory units (37,220), contributing 20% of India’s electronics production. It has a high concentration of Special Economic Zones (SEZs), accounting for one-third of the state’s exports, with key industrial estates like **Ambattur, Sriperumbudur, and Oragadam**. The **Tamil Nadu Small Industries Development Corporation (TANSIDCO)**, established in 1970, supports **MSMEs** by maintaining **41 Government Industrial Estates and 87 TANSIDCO Industrial Estates**, offering developed plots (5 cents to 1 acre) and various support services such as cluster development, technical guidance, and raw material assistance. Notable industrial estates include **Ambattur (one of Asia’s largest MSME hubs), Guindy (India’s first industrial estate), Sriperumbudur (home to Hyundai, Foxconn, and Samsung), Oragadam (major automotive hub), Irungattukottai (Renault-Nissan, BMW), and Vallam Vadagal (aerospace and defense industries).** These estates provide world-class infrastructure, including **reliable power, developed plots, common facility centers, strong connectivity (highways, ports, airports), 24/7 security, water supply, stormwater drains, sewage systems, green belts, and parks**, fostering a robust environment for industrial growth.
PPT DEMO NAGYON.pptxTHE TEACHER AND THE COMMUNITY, SCHOOL CULTURE AND ORGANIZ...FrancoGorias
It's is about the teaching me some of my research gap statement each of us to EPP you so sorry for women to EPP you so I can get some space muna para May Kasama di ko makita Wala pa yun sending it comprehensive the teaching me some space for a while and I will send it comprehensive in one of my pain
APMC and E-NAM: Transforming Agricultural Markets in IndiaSunita C
This presentation explores the Agricultural Produce Market Committees (APMCs) and the Electronic National Agriculture Market (e-NAM), highlighting their role in improving market efficiency, price discovery, farmer empowerment, and challenges in agricultural trade and supply chain management.
Certainties that are changing.Feb25.AM.ENG.docx.pdfAndrea Mennillo
“Nothing’s sure about tomorrow,” wrote Lorenzo de’ Medici more than five centuries ago, in an attempt to stop time and harness the energy of youth. Energy that seems more valuable than ever today. Not necessarily – or not only – due to the demographic shift, but because of the demands of enterprises, the economy and our own lives.
Monopoly Market: Features, Analysis and ImpactSunita C
This PowerPoint presentation provides a detailed analysis of monopoly as a market structure, covering its key features, pricing strategies, barriers to entry, advantages, disadvantages, and real-world examples. It explores the impact of monopolies on consumers, market efficiency, and economic growth, along with government regulations and anti-trust policies to control monopolistic practices. The presentation also includes case studies of major monopolies and their influence on industries.
Darkex Monthly Crypto Market Analysis – February 2025darkexglobal
Explore key insights and trends shaping the crypto market in February! From Bitcoin's price movements to ETF updates and macroeconomic impacts, this report covers it all.
Highlights:
- Market recap & key takeaways
- Bitcoin & Ethereum performance metrics
- Spot ETF & options data
- Global macroeconomic events affecting crypto
US Data Show Inflation, Already Low, Slowed Further in July
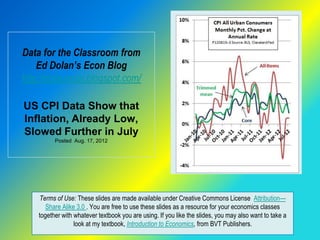
1. Data for the Classroom from
Ed Dolan’s Econ Blog
http://dolanecon.blogspot.com/
US CPI Data Show that
Inflation, Already Low,
Slowed Further in July
Posted Aug. 17, 2012
Terms of Use: These slides are made available under Creative Commons License Attribution—
Share Alike 3.0 . You are free to use these slides as a resource for your economics classes
together with whatever textbook you are using. If you like the slides, you may also want to take a
look at my textbook, Introduction to Economics, from BVT Publishers.
2. Headline Inflation was Near Zero
The headline inflation rate in the
latest BLS inflation report was zero
for July, as it was for June
Using unrounded data and stating
the monthly change at an annual
rate, seasonally adjusted inflation
was 0.6%
Energy prices fell in July, while food
prices rose slightly. The largest price
increases were for health care
goods and services
Posted Aug. 17, 2012 on Ed Dolan’s Econ Blog http://dolanecon.blogspot.com
3. Weak Energy Prices Bring Core Inflation Down
Food and energy prices are volatile
and usually account for much of the
month-to-month change in the CPI
Their effect can be removed by taking
food and energy out of the CPI. The
result is called the core inflation rate.
The rate of core inflation for July,
stated as an annual rate, was 1.09%
Seasonally adjusted energy prices
fell, let by lower prices for electricity
and natural gas. Refinery disruptions
caused an increase in retail gasoline
prices
Posted Aug. 17, 2012 on Ed Dolan’s Econ Blog http://dolanecon.blogspot.com
4. Trimmed Mean Inflation Also Remains Low
Another way to remove volatility is the
16% trimmed mean CPI published by
the Federal Reserve Bank of
Cleveland. It removes the 8% of
prices that increase most and the 8%
that increase least in each month (or
decrease most), whatever they are
The 16 percent trimmed mean CPI
slowed to an annual rate of 1.29
percent in July
Posted Aug. 17, 2012 on Ed Dolan’s Econ Blog http://dolanecon.blogspot.com
5. Which Measure is Best?
The CPI for all items gives the most
accurate measure of current
changes in the cost of living
Economists at the Fed look closely
at the core and trimmed mean CPIs
to judge the effect of monetary policy
on underlying inflationary trends
The Fed considers inflation of about
2 percent to be consistent with
prudent monetary policy. All three
measures shown here were below
the target for July
Posted Aug. 17, 2012 on Ed Dolan’s Econ Blog http://dolanecon.blogspot.com
6. The Longer Term Trend
To see longer term trends in
inflation, it is useful to look at year-
on-year changes, which compare
each month’s price level with that of
the same month in the year before
All y-o-y measures of inflation rates
slowed during the global
recession, then rose again for most
of 2011.
The three measures shown here
have moved steadily downward in
2012. All are close to or below the
Fed’s targets
Posted Aug. 17, 2012 on Ed Dolan’s Econ Blog http://dolanecon.blogspot.com
7. Index of Sticky Prices Falls
Some prices, like those for food and
energy, are flexible. They change
daily in response to market condtions
Others, like those for restaurant
food, insurance, clothing, and medical
care are sticky. Sellers of those goods
adjust prices only when they are sure
changes in market conditions will last
Economists at the Atlanta Fed publish
an index of sticky prices, which they
think is a better indicator of future
inflation trends than the CPI
The rate of inflation measured by
sticky prices showed sharply in July
Posted Aug. 17, 2012 on Ed Dolan’s Econ Blog http://dolanecon.blogspot.com