This webinar analyses energy efficiency trends in the EU for the period 2014-2019 and the impact of COVID-19 in 2020 (based on estimates from Enerdata).
The speakers present the overall trend in total energy supply and in final energy consumption, as well as details by sector, alongside macro-economic data. They will explain the main drivers of the variation in energy consumption since 2014 and determine the impact of energy savings.
Speakers:
Laura Sudries, Senior Energy Efficiency Analyst, Enerdata
Bruno Lapillonne, Scientific Director, Enerdata
The recordings of the presentation (webinar) can be viewed at:
https://youtu.be/8RuK5MroTxk
Auctions for Renewable Energy – Model based AnalysisLeonardo ENERGY
Auctions are increasingly being applied as a mechanism to allocate support to renewable energy sources (RES). AURES (Auctions for Renewable Energy Support) is a H2020 European research project focused on auction designs for renewable energy support. The project addresses the important and urgent issue of improving current support policies for electricity from renewable energy sources through competitive market measures. The general objective of the project is to promote an effective use and efficient implementation of auctions for renewable energy support in the European Union Member States, especially regarding their cost-efficiency.
In this new webinar series, the AURES team will share research results and provide guidance to policy makers on the best options to organize renewables support under the new rules of the Clean Energy Package.
The document summarizes a study on the feasibility of a community solar self-consumption project in the Mac-Donald district of Paris. The study reconstructed the energy footprint of the district and simulated how much of the consumption could be covered by solar panels on rooftops. Different allocation keys were explored to optimize savings for users while ensuring profitability for investors. The study found that installing solar panels could cover 20% of the district's needs and save users and the community money while reducing carbon emissions.
This document discusses solar energy and solar self-consumption. It begins by covering energy sources in general before focusing on renewable vs non-renewable sources. Solar energy harnesses the sun's rays and works through photovoltaic technologies. Solar self-consumption uses on-site PV generation to meet a consumer's energy needs. The document then introduces the archeliosTM Calc software, which allows for calculation, sizing and control of self-consumption PV installations.
This document summarizes the findings of a European Power Quality Survey conducted between 2005-2006. It interviewed representatives from key industrial sectors across 8 European countries to understand the economic impacts of poor power quality.
The study found that poor power quality, such as voltage dips, interruptions and harmonics, results in annual losses estimated at over €150 billion for the sectors surveyed. Dips and interruptions accounted for around 60% of losses. Losses were higher in manufacturing industries compared to services sectors.
Regression analysis indicated power quality related wastage was approximately 4% of annual turnover for industry and 0.14% for services. The document provides detailed methodology used to calculate different types of power quality costs from direct financial losses
Primary Energy Demand of Renewable Energy Carriers - Part 1Leonardo ENERGY
Primary energy factors (PEF), often referred to as conversion factors, are required to calculate the total energy consumption including the total chain of energy generation based on the final energy consumption data.
In this webinar, different primary energy definitions, accounting methods, and their applications with a focus on electricity and heat generation from renewable energy will be presented. In addition to renewable energy sources, primary energy factors for electricity from waste, nuclear, and imported electricity are also discussed as these can be calculated in different ways. Depending on the methodology used, it will be shown that the resulting PEFs for different energy sources vary significantly.
Introduction to the Energy Efficiency DirectiveLeonardo ENERGY
The Energy Efficiency Directive (EED) was adopted in 2012 and is one of the EU’s four key Directives addressing energy efficiency in stationary (i.e. non transport) end-uses (the others being the Energy Performance in Buildings Directive, The Ecodesign Directive and the Energy Labelling Directive). Given that the other Directives cover the energy performance of buildings and equipment the EED is designed to address energy savings opportunities that are not readily addressed by the other Directives. It has its origin in the preceding Energy Services Directive, which was repealed when the EED was adopted. The Energy Efficiency Directive establishes a set of binding measures intended to help the EU reach its 20% energy efficiency target by 2020. Under the Directive, all EU countries are required to use energy more efficiently at all stages of the energy chain from its production to its final consumption. EU countries were required to transpose the Directive's provisions into their national laws by 5 June 2014.
In 2011, the European Commission concluded in its white paper “Roadmap to a Single European Transport Area” that the phase-out of fossil fuels driven cars by 2050 was necessary to achieve its energy and climate objectives. In 2019, as part of the European Green Deal, the Commission is proposing to revise the regulation on CO2 standards for cars and vans, to ensure a clear pathway towards zero-emission mobility.
Greenhouse gas (GHG) emissions due to road transport have grown since 1990 by 20.5%, and now account for one-fifth of EU GHG emissions – and they keep growing. The picture is similar regarding final energy consumption. Road transport uses 24% of EU final energy, having grown by 28% since 1990.
The good news is that a zero-emission technology is ready today for market uptake: the battery electric vehicle. From day one this vehicle completely cuts local GHG and air pollutant emissions and emits three times less GHG emissions on a well-to-wheel basis. On a life cycle basis (“cradle to grave”), a battery electric vehicle also generates significantly less GHG emissions than cars using gasoline or diesel. Moreover, the full decarbonisation of the electricity system, which is foreseen well before 2050, will enable battery electric vehicles to make transport fully climate-neutral.
Electrifying road transport is also the fastest and most cost-effective way to achieve energy efficiency goals because it is the asset with the highest replacing rate (average car ownership period 5-7 years1)and is currently at least 2.5 times more efficient than alternative technologies.
On 28 November 2019 the European Parliament declared a climate emergency and its Members asked for immediate and ambitious action to limit the effects of climate change2. Battery electric vehicles are ready to contribute to addressing this challenge. What is needed now is to accelerate the deployment of full electric vehicles.
Copper is one of the main materials that makes this transition possible. On average a battery electric vehicle requires three times more copper than a vehicle driven by a combustion engine. Half of it is in the battery system, mainly as foil in the anode of the cell working as current collector and heat dissipator. About one quarter is in the drive motors and their control system, and the other quarter is in wire harness, connectors and electronics. In addition, copper plays a role in the charging infrastructure and in the generation of renewable electricity to power the vehicles.
Energy efficiency trends in transport in the EULeonardo ENERGY
After 6 years of regular decrease, the energy consumption of transport in the EU has been rising again since 2013, at the same rate as before the financial crisis. It has become the most energy-consuming end-use sector, responsible for 31% of the final energy consumption in the EU27 in 2019. The energy transition in transport lags far behind the other sectors. However, some countries are performing better than others.
During this webinar, our expert speakers present an evaluation of the energy efficiency trend in the European transport sector since 2000. The following key questions are addressed:
What has been the overall trend in transport energy consumption in the EU and other European countries since 2000?
What are the main drivers for the energy consumption variation in transport, and in particular for the energy savings?
Recordings of the webinar: https://youtu.be/3TbePJCDvgE
This webinar is dedicated to the findings of the 3rd issue of the PV Grid Parity Monitor for Residential Consumers.
The Photovoltaic Grid Parity Monitor analyses PV competitiveness with retail electricity prices for residential consumers and assesses local regulation for self-consumption of 21 cities in 12 countries (Australia, Brazil, Chile, France, Germany, Italy, Israel, Japan, Mexico, Spain, UK, USA).
It is based on a rigorous and transparent methodology and has used real and updated data provided by local PV installers, local PV associations and other reliable players from the PV industry. A specific and in-depth analysis of retail electricity rates for each of the 21 cities is included.
Given that PV Grid Parity represents a unique opportunity to develop a local and sustainable power generation technology in a cost-effective way, this Monitor aims at giving benchmark elements and good practice models to foster the development of this technology.
http://www.leonardo-energy.org/webinar/3rd-photovoltaic-grid-parity-monitor-residential-consumers-session-1
Energy efficiency first – retrofitting the building stock finalLeonardo ENERGY
Retrofitting the building stock is a challenging undertaking in many respects - including costs. Can it nevertheless qualify as a measure under the Energy Efficiency First principle? Which methods can be applied for the assessment and what are the results in terms of the cost-effectiveness of retrofitting the entire residential building stock? How do the results differ for minimization of energy use, CO2 emissions and costs? And which policy conclusions can be drawn?
This presentation was used during the 18th webinar in the Odyssee-Mure on Energy Efficiency Academy on February 3, 2022.
A link to the recording: https://youtu.be/4pw_9hpA_64
The sEEnergies project aims to operationalize the energy efficiency first principle (EEFP) both qualitatively and quantitatively. It will develop a decision support tool combining sector-specific energy demand models to analyze EE potentials from an energy systems perspective. Bottom-up models of buildings, transport, industry and grids will provide cost curves and potentials for EE measures. Scenarios from the EU's "A Clean Planet for All" will be used as common references. Energy system modelling will assess EEFP impacts and enable scenarios assessing synergies. A spatial model will map supply and demand and efficiency potentials. Heat Roadmap Europe provides recommendations including prioritizing savings over supply, utilizing excess heat and renewable energy in district heating, and establishing
Perform, Achieve, and Trade (PAT) – An Innovative Programme to Promote Indust...Leonardo ENERGY
Enhanced energy efficiency in industrial sector is a challenge inasmuch as it competes for investment with new production capacity. However, it is also an opportunity since it enables higher productivity and greater competitiveness. The Perform, Achieve, and Trade (PAT) programme in India focuses on monetary reductions in specific energy consumption (SEC) of production units in energy intensive industrial sectors. In order to address issues of equity and inclusiveness, the programmes included all energy intensive plants in selected sectors, even the most energy efficient ones. However, the SEC reduction target was less for plants that are already more efficient. Further, third-party verification and issuance of certification for excess savings (more than the target) help in achieving transparency and enabling greater effort. The target savings were over-achieved by about one-third in the first cycle, and subsequently second and third cycles have been launched.
Energy Sufficiency Indicators and Policies (Lea Gynther, Motiva)Leonardo ENERGY
This policy brief looks at questions ‘how to measure energy sufficiency’, ‘which policies and measures can be used to address energy sufficiency’ and ‘how they are used in Europe today’.
Energy sufficiency refers to a situation where everyone has access to the energy services they need, whilst the impacts of the energy system do not exceed environmental limits. The level of ambition needed to address energy sufficiency is higher than in the case of energy efficiency.
This is the 13th edition of the Odyssee-Mure on Energy Efficiency Academy, and number 519 in the Leonardo ENERGY series. The recording of the live presentation can be found on https://www.youtube.com/watch?v=jEAdYbI0wDI&list=PLUFRNkTrB5O_V155aGXfZ4b3R0fvT7sKz
Energy efficiency trends in the EU: Have we got off track?Diedert Debusscher
What has been the overall trend in final energy consumption and by sector in the EU since 2000? What are the main drivers of the energy consumption variation since 2000, and what has been the impact of energy savings? What are the trends in energy efficiency at the country level?
These are the key questions that will guide you through this webinar analysing energy efficiency trends in the EU for the period 2000-2019.
This presentation deck was used during the 9th webinar in the Odyssee-Mure on Energy Efficiency Academy on 25 June 2020. Recordings are available on https://www.youtube.com/user/LeonardoENERGY/videos?view=0&sort=dd&flow=grid
The webinar is an approximately 45 min presentation, followed by a live Q&A session with the panellists.
Electric motors
Editorial - Policy solutions - Facts - Interview - Success stories - Improving market surveillance - Extended product approach - Motor maintenance and refurbishment - Accelerated replacement of less efficient motor stock - Developing powertrains for electric mobility free of critical raw materials - World landscape
The goal of DecarbEurope is to engage decision-makers in policy and industry with solutions that can, in a cost-effective manner, decarbonise Europe at the scale and speed that is needed to achieve our climate goals.
As an ecosystem of twenty sectors — and growing — the initiative connects technologies, policies, and markets. Partners of DecarbEurope commit themselves to common values of deep decarbonisation, cost-effectiveness, circularity, sector-coupling and consumer engagement.
Electric motors play a major role in all economic sectors (industrial, tertiary, residential, agricultural and in transportation), to deliver in a reliable and efficient way mechanical power to a huge variety of processes and services
Professor Brian Vad Mathiesen, Sustainable Energy Planning Research Group,Aalborg University
EFCF2020: 24th conference in series of the European Fuel Cell Forum in Lucerne, October 22, 2020
Auctions for energy efficiency and the experience of renewablesLeonardo ENERGY
Auctions are an emerging market-based policy instrument to promote energy efficiency that has started to gain traction in the EU and worldwide. This presentation provides an overview and comparison of several energy efficiency auctions and derives conclusions on the effects of design elements based on auction theory and on experiences of renewable energy auctions. We include examples from energy efficiency auctions in Brazil, Canada, Germany, Portugal, Switzerland, Taiwan, UK, and US.
A recording of this presentation can be viewed at:
https://youtu.be/aC0h4cXI9Ug
Energy efficiency trends in buildings in the EULeonardo ENERGY
- Energy consumption in buildings in the EU accounts for 43% of final energy consumption and 60% of electricity consumption. There is a need for ambitious policies to improve energy efficiency in buildings to meet 2030 targets and make Europe climate neutral by 2050.
- Energy consumption in buildings has been relatively stable since 2014 while GDP has risen. Residential buildings account for two-thirds of buildings consumption. Space heating is the dominant end-use but its consumption is declining, while appliances and lighting consumption are rising.
- The EU's energy efficiency index (ODEX) shows that household energy efficiency has improved 29% from 2000-2019, but progress slowed after 2014 mainly for space heating, water heating, and cooking. For
Energy efficiency trends in buildings in the EU (update)Leonardo ENERGY
(This is an updated version of the slides used during the 11th webinar in the Odyssee-Mure on Energy Efficiency Academy at 08 Dec 2020. This version addresses pending questions with some more details and references.)
What has been the overall trend in final energy consumption of buildings in the EU since 2010?
What are the main drivers of the energy consumption variation, and in particular energy savings, for residential and service buildings?
These are the key questions answered during this (11th) webinar in the Odyssee-Mure on Energy Efficiency Academy.
Highlights from their research:
➢The energy consumption of buildings has steadily decreased since 2010 despite GDP growth.
➢There are large disparities in building performances across countries.
➢Since 2015, the rate of household energy efficiency improvements has dropped by 50% (compared to 2000-2014).
➢Energy efficiency of large electrical appliances, which has largely improved in the past, does not counterbalance anymore the rapid growth of the consumption of small appliances.
The document provides information about energy efficiency learnings and models in Finland. It discusses Finland's targets for 2020 related to reducing greenhouse gas emissions and increasing the share of renewables and energy efficiency. It describes the various tools Finland uses to promote energy efficiency, including legislation, subsidies, voluntary agreements and energy auditing. It also outlines the typical steps involved in energy auditing and management in Finland, and provides examples of energy savings identified in audits of industrial facilities.
Review: Potential Ecodesign regulation for economic cable conductor sizing in...Leonardo ENERGY
Increasing the conductor cross sectional area (CSA) of a cable reduces its energy losses. The most economic CSA is that for which the cable investment cost is equal to the total lifetime cost of energy losses.
Cable sizing is subject to regulation through national building codes, but these only take safety and aspects of functionality into account, not energy efficiency. These mandatory cable sizing prescriptions have given rise to the general misconception that following them precisely is best practice. The notion that the regulations are only the bare minimum requirement is often disregarded. As a result, economic cable sizing is not usually even taken into consideration during installation design or energy management initiatives.
Economic cable sizing cannot be derived just from the physical design parameters, but depends on the load profile of the electrical circuit in which the cable is used. Consequently, it is not the cable and its current-carrying capacity that should be regulated, but the choice of the cable cross section in the context of the electrical circuit and its load profile – in other words the installed cable system.
Approximately 8% of the electrical energy generated in the EU gets lost in the network between generation and end-use. Of this 8%, around 6% represents losses in the transmission and distribution network and 2% is behind-the-meter. Of the latter, 1.5% can be attributed to non-residential buildings – around 50 TWh per year – and the remaining 0.5% to residential buildings.
Grid Expansion under high VRE share using Grid-featured Japan TIMES modelIEA-ETSAP
1) The document discusses a Japan TIMES-based energy system model that includes grid features and renewable energy potential data at a high node resolution to analyze the role of grid expansion under high renewable energy penetration.
2) Simulation results show that without grid expansion, renewable energy capacity is lower and electricity prices vary more across regions.
3) Achieving Japan's long term carbon target of 80% reduction by 2050 would require significant grid connections from Hokkaido to Tokyo via Tohoku to enable optimal use of renewable resources.
The need for an updated European Motor Study - key findings from the 2021 US...Leonardo ENERGY
The document calls for an updated assessment of the electric motor system market in Europe, as the existing data is over 20 years old. It notes several changes in the market since then, including new efficient motor technologies, lower costs for power electronics, and increased digitization. The document highlights findings from a recent 2021 US motor study, which found motors to be older than previously estimated and significant improvements in load factors and variable speed drive penetration compared to past studies. It concludes that a new comprehensive assessment is needed to identify large potential electricity savings and inform policies to accelerate market transformation.
A review of systems approaches in Ecodesign and Energy LabellingLeonardo ENERGY
It is widely recognised that there are substantial energy savings to be made from considering an energy system – how products are combined and operated – in addition to those from each product.
Recent ecodesign and energy label regulations and the ecodesign and energy label working plan which is currently in development are not adopting these approaches. The European Copper Institute wishes to understand why this is and if there is evidence to support challenging this omission. They commissioned this research to look into the experience with developing system related ecodesign and energy labelling regulations to date.
Systems have increasingly been studied explicitly, rather than as an ‘added benefit’ to a basically product based approach. This is in recognition of the additional energy savings which are accessible via a system approach.
This project has reviewed studies on eight product groups, most of them ecodesign and energy labelling preparatory or review studies:
* Walk-in cold rooms (WICRs)
* WICRs
* Case study method for heating systems
* Lighting systems
* “points system” approach
* Pumps
* Heater and water heater package energy label
* Solar Photovoltaics (PV) (system energy label)
* Solar PV (system energy label)
* Building Automation and Control Systems (BACS)
* Power cables
Addressing flexibility and decarbonization of energy systems through TIMES mo...IEA-ETSAP
Addressing flexibility and decarbonization of energy systems through TIMES modelling: the case of European Islands.
Ms. Sophie Chlela, Centre for Applied Mathematics (CMA), MINES Paristech
A new generation of instruments and tools to monitor buildings performanceLeonardo ENERGY
What is the added value of monitoring the flexibility, comfort, and well-being of a building? How can occupants be better informed about the performance of their building? And how to optimize a building's maintenance?
The slides were presented during a webinar and roundtable with a focus on a new generation of instruments and tools to monitor buildings' performance, and their link with the Smart Readiness Indicator (SRI) for buildings as introduced in the EU's Energy Performance of Buildings Directive (EPBD).
Link to the recordings: https://youtu.be/ZCFhmldvRA0
Overview of Bioenergy Scenarios in TIMES modellingIEA-ETSAP
The document summarizes scenarios for bioenergy use in energy system models developed by IEA ETSAP. It provides an overview of the IEA ETP modeling framework and how bioenergy technologies are represented. It then gives two examples of bioenergy scenarios: 1) the IEA ETP scenarios which estimate a need for 145 EJ of sustainable bioenergy by 2060 for a 2 degree pathway, focusing on transport, and negative emissions technologies for below 2 degrees. 2) A study of Ireland's energy system which found implementing land use change emissions significantly impacted the role of bioenergy due to increased costs.
Long-term impacts of 2020 COVID-19 pandemic on EU energy dimensionIEA-ETSAP
This document summarizes a study on the long-term impacts of the 2020 COVID-19 pandemic on the EU energy system. Scenarios were developed using linked economic and energy system models to assess impacts through 2030 under different economic recovery and climate policy scenarios. Results show reductions in CO2 emissions and energy consumption due to behavior changes like remote working. Increased renewable energy investments could be supported by the EU's COVID recovery fund, contributing up to half of needed power generation investments under an ambitious climate policy scenario.
Energy efficiency trends in the EU: Have we got off track?Leonardo ENERGY
What has been the overall trend in final energy consumption and by sector in the EU since 2000? What are the main drivers of the energy consumption variation since 2000, and what has been the impact of energy savings? What are the trends in energy efficiency at the country level?
These are the key questions that will guide you through this webinar analysing energy efficiency trends in the EU for the period 2000-2019.
This presentation deck was used during the 9th webinar in the Odyssee-Mure on Energy Efficiency Academy on 25 June 2020. Recordings are available on https://youtu.be/ucd7J_kYbEk
Second Stakeholder Event for the Revision of Directive (REDII) 2018/2001
Session 2 Renewable energy in Heating and Cooling, Buildings and District Heating
Professor Brian Vad Mathiesen, Aalborg University
March 22, 2021, Brussels - Online
Energy and environmental impacts of biomass use in the residential Sector: a ...IEA-ETSAP
The document analyzes the energy and environmental impacts of increased biomass use in residential heating in Italy through 2030 under various policy scenarios. It finds that:
1) Under a reference scenario that meets 2020 targets, biomass consumption in the residential sector increases to around 19 Mtoe by 2030, accounting for over 60% of fine particulate emissions.
2) A constant biomass scenario that limits consumption to 2014 levels still meets emissions reductions but achieves a slightly different energy mix.
3) A deeper decarbonization scenario reduces emissions 36% by 2030 primarily through reductions in transport, buildings, and industry, with renewables reaching 28% of total energy supply.
Keeping our cities sustainably warm - Inspiring the Efficient Renewal of District Heating for the Just Transition
Brian Vad Mathiesen, Aalborg University
KeepWarm Conference, November 12, 2020, Brussels - Online
After the Fukushima accident, a national debate regarding French energy transition was launched. A policy goal of reducing nuclear electricity generation from 75% to 50% share of total generation was established. Since the year 2013, electricity consumption has stabilized in France, the share of renewable sources continues to grow and there is a high level of hydropower production. Thus, means of conventional thermal generation are rarely used. In addition, electricity generation and capacity continue to increase as the country remains a net energy exporter. This webinar analyses past, present and future of the country from an energetic point of view.
Leonardo Senni, Head of the Department of Energy , Italian Ministry of Econom...WEC Italia
Slides presentate in occasione del Seminario "The Energy transition in Europe: different pathways, same destination? organizzato da Edison in collaborazione con WEC Italia il 29 maggio 2013 a Roma - TWITTER #NRGstrategy
Keynote, 15th Conference on Sustainable Development of Energy, Water and Environment Systems (SDEWES)
Brian Vad Mathiesen, Aalborg University
Online, Cologne, September 3rd 2020
This document discusses energy efficiency and smart communities from a European Union perspective. It provides background on climate and energy targets in the EU, the development of the Energy Union initiative, and key policy areas like secure energy supplies, completing the internal energy market, promoting energy efficiency, reducing emissions, and boosting research and innovation. It also examines the role of smart cities, sustainable buildings, and EU funding mechanisms like the Covenant of Mayors in supporting energy and climate goals at the local level.
Towards 32% renewable energy in 2030 - French public policies for renewablesStéfan Le Dû
France's Climate Plan Seminar, 20th November 2017
French Embassy in Tokyo
Audience: representatives of Japanese government, companies, NGOS ; representatives of French energy companies in Japan
More information about the seminar: https://www.tresor.economie.gouv.fr/Articles/2017/11/21/seminaire-de-presentation-du-plan-climat-de-la-france-tokyo-novembre-2017
Germany is Europe’s biggest energy consumer. As a large and industrial country with moderate natural endowments, it sets an example of what can be done with a progressive energy policy. Germany leads the charge on renewables, has an ambitious energy efficiency policy, is committed to phasing out nuclear power generation and uses ETS revenues fully for the fight against climate change. However, the future of the German energy transition is rather uncertain. Are energy prices sustainable with the current high taxation rates? How to expand the high-voltage grid to integrate wind generation from the North? What will be the future role of coal and gas? In this discussion webinar, we will review the most important energy statistics for Germany, present a few highlights on its energy policy and conclude with a series of open discussion points.
Germany is Europe’s biggest energy consumer. As a large and industrial country with moderate natural endowments, it sets an example of what can be done with a progressive energy policy. Germany leads the charge on renewables, has an ambitious energy efficiency policy, is committed to phasing out nuclear power generation and uses ETS revenues fully for the fight against climate change. However, the future of the German energy transition is rather uncertain. Are energy prices sustainable with the current high taxation rates? How to expand the high-voltage grid to integrate wind generation from the North? What will be the future role of coal and gas? This webinar presentation reviews the most important energy statistics for Germany, focussed on a few highlights of its energy policy and concludes with a series of open discussion points.
GHG emission reduction due to energy efficiency measures under climate policyIEA-ETSAP
This document summarizes the results of a study analyzing the impact of energy efficiency measures on greenhouse gas (GHG) emissions under different climate policy scenarios. The study used three energy-economic models, including TIAM-ECN, and focused on G20 countries through 2030. The results showed that energy efficiency measures could reduce global GHG emissions by 15-25% by 2050 in a cost-effective manner. Higher reductions occurred in the near-term (2020-2030). Energy efficiency in the power sector, industry and transport offered significant opportunities, especially in China, India, and the U.S. The models agreed that energy efficiency could offset cumulative emissions by 2-3 gigatons of CO2 equivalent by
1/3/2016 Raising the temperature of the UK heat pump market: Learning lessons...Matthew Hannon
The document discusses lessons that can be learned from Finland's successful adoption of heat pumps to help the UK meet its climate targets. Finland now has over 500,000 heat pumps installed, providing 6% of its heat. There are similarities between current Finnish and targeted UK (2030) heat pump usage. Key factors driving Finland's growth include policies incentivizing efficiency upgrades and new construction, regulations requiring efficient buildings, and funding energy innovation. The document recommends the UK adopt similar policies around new builds, retrofits, long-term incentives, focusing on off-grid homes, and increasing investment in heat pump technology innovation.
More than 20 years ago, the EU vowed to fight the newly identified danger of climate change. Over time, it has developed a policy which is two-fold: on one hand, it looks at ways to reduce greenhouse gas emissions inside EU borders and now has 2050 as horizon; on the other hand, it tends to lead by example and to push other big emitters to gather around similar emission reduction objectives.
Pursuing the idea of giving a price to carbon, the EU has put in place an instrument that would lead it towards decarbonisation: the Emissions Trading Scheme (ETS). Launched in 2005, it has today become a complex system which is being reproduced in other parts of the world. The ultimate vision is one of a global carbon market leading to a significant reduction of greenhouse gas emissions and thus mitigating the impact of climate change.
Addressing the Energy Efficiency First Principle in a National Energy and Cli...Leonardo ENERGY
When designing energy and climate policies, EU Member States have to apply the Energy Efficiency First Principle: priority should be given to measures reducing energy consumption before other decarbonization interventions are adopted. This webinar summarizes elements of the energy and climate policy of Cyprus illustrating how national authorities have addressed this principle so far, and outline challenges towards its much more rigorous implementation that is required in the coming years.
How auction design affects the financing of renewable energy projects Leonardo ENERGY
Recording available at https://youtu.be/lPT1o735kOk
Renewable energy auctions might affect the financing of renewable energy (RE) projects. This webinar presents the results of the AURES II project exploring this topic. It discusses how auction designs ranging from bid bonds to penalties and remuneration schemes impact financing and discusses creating a low-risk auction support framework.
This presentation discusses the contribution of Energy Efficiency Funds to the financing of energy efficiency in Europe. The analysis is based on the MURE database on energy efficiency policies. As an example, the German Energy Efficiency Fund is described in more detail.
This is the 17th webinar in the Odyssee-Mure on Energy Efficiency Academy.
Recordings are available on: https://youtu.be/KIewOQCgQWQ
(see updated version of this presentation:
https://www.slideshare.net/sustenergy/energy-efficiency-funds-in-europe-updated)
The Energy Efficiency First Principle is a key pillar of the European Green Deal. A prerequisite for its widespread application is to secure financing for energy efficiency investments.
This presentation discusses the contribution of Energy Efficiency Funds to the financing of energy efficiency in Europe. The analysis is based on the MURE database on energy efficiency policies. As an example, the German Energy Efficiency Fund is described in more detail.
This is the 17th webinar in the Odyssee-Mure on Energy Efficiency Academy.
Recordings are available on: https://youtu.be/KIewOQCgQWQ
Five actions fit for 55: streamlining energy savings calculationsLeonardo ENERGY
During the first year of the H2020 project streamSAVE, multiple activities were organized to support countries in developing savings estimations under Art.3 and Art.7 of the Energy Efficiency Directive (EED).
A fascinating output of the project so far is the “Guidance on Standardized saving methodologies (energy, CO2 and costs)” for a first round of five so-called Priority Actions. This Guidance will assist EU member states in more accurately calculating savings for a set of new energy efficiency actions.
This webinar presents this Guidance and other project findings to the broader community, including industry and markets.
AGENDA
14:00 Introduction to streamSAVE
(Nele Renders, Project Coordinator)
14:10 Views from the EU Commission and the link with Fit-for-55 (Anne-Katherina Weidenbach, DG ENER)
14:20 The streamSAVE guidance and its platform illustrated (Elisabeth Böck, AEA)
14:55 A view from industry: What is the added value of streamSAVE (standardized) methods in frame of the EED (Conor Molloy, AEMS ECOfleet)
14:55 Country experiences: the added value of standardized methods (Elena Allegrini, ENEA, Italy)
The recordings of the webinar can be found on https://youtu.be/eUht10cUK1o
Energy and mobility poverty: Will the Social Climate Fund be enough to delive...Leonardo ENERGY
Prior to the current soaring energy prices across Europe, the European Commission proposed, as part of the FitFor55 climate and energy package, the EU Social Climate Fund to mitigate the expected social impact of extending the EU ETS to transport and heating.
The report presented in this webinar provides an update of the European Energy Poverty Index, published for the first time in 2019, which shows the combined effect of energy and mobility poverty across Member States. Beyond the regular update of the index, the report provides analysis of the existing EU policy framework related to energy and transport poverty. France is used as a case study given the “yellow vest” movement, which was triggered by the proposed carbon tax on fuels.
Watch the recordings of the webinar:
https://youtu.be/i1Jdd3H05t0
Does the EU Emission Trading Scheme ETS Promote Energy Efficiency?Leonardo ENERGY
This policy brief analyzes the main interacting mechanisms between the Energy Efficiency Directive (EED) and the EU Emission Trading Scheme (ETS). It presents a detailed top-down approach, based on the ODYSSEE energy indicators, to identify energy savings from the EU ETS.
The main task consists in isolating those factors that contribute to the change in energy consumption of industrial branches covered by the EU ETS, and the energy transformation sector (mainly the electricity sector).
Speaker:
Wolfgang Eichhammer (Head of the Competence Center Energy Policy and Energy Markets @Fraunhofer Institute for Systems and Innovation Research ISI)
The recordings of this webinar can be watched via:
https://youtu.be/TS6PxIvtaKY
Energy efficiency, structural change and energy savings in the manufacturing ...Leonardo ENERGY
- Structural changes in manufacturing have significantly reduced energy consumption in Denmark since 1990 through growth in lower intensity sectors like food production.
- Energy efficiency improvements also contributed, especially from 2010-2014, lowering consumption alongside structural changes.
- A decomposition analysis found that decreases in consumption from 2006-2014 were mainly from structural effects in the first half, and efficiency gains in the latter half.
- Reported energy savings from Denmark's energy efficiency obligation scheme align with estimated efficiency improvements, though some autonomous gains likely occurred too.
The Super-efficient Equipment and Appliance Deployment (SEAD) Initiative Prod...Leonardo ENERGY
The Super-efficient Equipment and Appliance Deployment (SEAD) Initiative Product Efficiency Call to Action, by Melanie Slade - IEA and Nicholas Jeffrey - UK BEIS
Breuckmann eMobility GmbH develops innovative rotor casting technology called Zero Porosity Rotor (ZPR) for electric vehicle induction motors. ZPR uses laminar squeeze casting to produce rotors with zero porosity, allowing for superior mechanical properties, higher electrical conductivity, and maximum process stability compared to industry standard rotors. Key advantages of ZPR rotors include up to 12.5% higher maximum rotational speed, 35% higher electrical conductivity, and ability to withstand 25% higher circumferential bursting speeds. Breuckmann has partnerships for motor testing, slot geometry design, and received EU funding to develop high-speed motor concepts using its ZPR technology.
dynamic E flow GmbH provides high-tech electric machines and solutions for extreme applications. Their capcooltech® motor features direct winding cooling that enables current densities up to 100A/mm2 and overload capacities. Testing shows the capcooltech® design maintains temperatures 40°C lower and heats 10 times faster than conventional cooling. The direct cooling test bench demonstrates capcooltech® motors can achieve maximum power density, temperature resistance, precision, and dynamics even in harsh conditions like vacuum or high temperatures.
Efficient motor systems for a Net Zero world, by Conrad U. Brunner - Impact E...Leonardo ENERGY
1) The document discusses the need for efficient electric motor systems to achieve net-zero emissions by 2050, as electricity will be the main energy supplier without fossil fuels or nuclear.
2) It provides examples of how industry can achieve efficiency savings of 50-70% through measures like downsizing components, direct drive systems, and load control.
3) A case study shows how converting an oversized 10kW system to a smaller, variable speed, direct drive setup with efficient components achieves 82% energy savings and a payback period of just one year.
Towards a systems approach in Ecodesign and Energy Labelling: How to make the...Leonardo ENERGY
This document discusses moving towards a systems approach in ecodesign and energy labelling regulations. It provides an overview of some challenges in regulating systems compared to individual products, including assessing system efficiency, identifying responsible parties, and challenges for market surveillance authorities. Examples of studies on specific systems like heating/water heating packages, lighting systems, and pumps are mentioned. Views from the EU Commission emphasize that ecodesign regulations currently apply to individual goods placed on the market, but can also cover systems if they are put together on location. Moving towards more systems approaches could increase energy savings but also introduces complexity around testing, compliance, and enforcement.
Motivation, benefits, and challenges for new photovoltaic material & module d...Leonardo ENERGY
The main objective of the IEA-PVPS Task 13 Report on “Designing New Materials for Photovoltaics: Opportunities for Lowering Cost and Increasing Performance through Advanced Material Innovations” is to provide a global survey of technical efforts aimed at lowering cost and increasing performance and reliability of PV modules by employing new designs, materials and concepts. Furthermore, the report aims to (1) increase the exchange of information about promising materials and design concepts, (2) provide the means for increasing the value of PV modules, (3) provide recommendations on characterization methods for new technologies and (4) give input regarding new requirements for standardization. This paper focuses on describing the motivation, benefits, and challenges for new photovoltaic material and module developments.
Lessons learnt from the EEA catalogue of environment and climate policy evalu...Leonardo ENERGY
The EEA catalogue of environment and climate policy evaluations is a database of about 600 evaluations. This webinar will present the objectives and contents of this catalogue, how it has been developed and what lessons can be learnt from this compilation.
ModulED. Next generation powertrains for electric vehiclesLeonardo ENERGY
Presentation of the final event for the three GV04 projects: ReFreeDrive, ModulED and Drivemode. Recordings available at https://www.youtube.com/playlist?list=PLUFRNkTrB5O-38psbMgeWAvzXQ5QWzNsk.
ModulED aims at developing a new generation of modular electric engine based on buried-permanent magnet motor with reduced rare earth use, and electric drivetrain for various configurations of Full and Hybrid Electric Vehicles (including cost, environmental impact, efficiency, and mass manufacturing ready).
Drivemode Next Generation Electric Drivetrains for Fully Electric Vehicles Leonardo ENERGY
Presentation of the final event for the three GV04 projects: ReFreeDrive, ModulED and Drivemode. Recordings available at https://www.youtube.com/playlist?list=PLUFRNkTrB5O-38psbMgeWAvzXQ5QWzNsk.
Integrated Modular Distributed Drivetrain for Electric & Hybrid Vehicles
Madhu Rajan is a journalist and media personality known for his dedication to bringing important stories to light. Based in Bridgewater, New Jersey, Rajan has built a reputation for his in-depth reporting on social issues, humanitarian causes, and community resilience.
UNDERSTANDING KENYA’S POSITION IN THE INDO-PACIFIC main document (10).pdfsamngacha
Reflective News provides in-depth analysis and coverage of various global and
regional issues. The platform focuses on topics such as Kenya's strategic position in the
Indo-Pacific region, the influence of China, Japan, South Asia in Kenyan affairs, and the
impact of climate change on Kenya. Reflective News aims to offer insightful perspectives
on political, economic, and social developments, helping readers understand the
complexities of the modern world
How Estevan Mercury Shaped Community Journalism for 122 YearsNorthland News
The Estevan Mercury has played a vital role in the city’s media landscape for more than a century. As one of the longest-running newspapers in Saskatchewan, its closure marks the end of an era for local journalism. With its final edition, No. 1228, the publication leaves behind a rich legacy of informing, educating, and connecting the people of Estevan. Editor David Willberg announced the difficult decision on social media, leading to an outpouring of tributes from residents and journalists alike. While print editions will no longer be available, articles from Estevan will still be accessible through SaskToday.ca.
The Future of Health Data Platforms_ Trends to Watch in the Next Decade.pdfInsider Market Research
Health data platforms in 2025: 1. Epic Systems 2. HealthTap 3. Teladoc Health 4. Fitbit 5. Practo 6. Zocdoc 7. Ada Health 8. Welltok 9. Apple Health and more
The Johns Hopkins Maya Trial_ A Landmark Case of Medical Negligence.docxvoice ofarticle
The Johns Hopkins Maya trial has captured national attention as a defining case of medical negligence, legal controversy, and institutional accountability. Filed by the Kowalski family against Johns Hopkins All Children’s Hospital, the lawsuit centers around the alleged mistreatment of Maya Kowalski, a young girl diagnosed with Complex Regional Pain Syndrome (CRPS). The jury’s verdict, awarding the family $261 million, has ignited discussions about patient rights, medical ethics, and legal recourse in cases of hospital negligence.
The Tragic Case of Teresa Youngblut & the Fatal Shooting of David Maland.docxvoice ofarticle
On January 20, 2025, a routine traffic stop on Interstate 91 in Coventry, Vermont, escalated into a deadly encounter, resulting in the fatal shooting of U.S. Border Patrol Agent David Maland. The suspect, 21-year-old Teresa Youngblut, was taken into custody following the incident, while Felix Bauckholt, a German national, was also implicated. Authorities are investigating potential ties to the radical Zizian cult, raising national concerns. The tragic event has sparked debates on law enforcement safety and extremist threats. As details emerge, officials continue to piece together the circumstances surrounding this shocking act of violence.
Visit Here: https://voiceofarticle.com/teresa-youngblut/
John Schmitz touts his business acumen and helping the poor. However the record shows more than 50 code violations on his properties that he's owned in the past.
Millions Withdrawn Amid Scandal Surrounding Libra Crypto Token.pdfCIOWomenMagazine
Blockchain researchers have revealed that approximately $99 million worth of cryptocurrency was withdrawn from the marketplace of the controversial Libra Crypto Token.
How Edvardas Kuprenas Fooled Business Leaders Around the World.pdfnathaniel leonard
Edvardas Kuprenas orchestrated a global financial fraud, deceiving investors across Switzerland, Dubai, and Singapore before vanishing with millions. Discover how Gatwick operated, the ongoing manhunt, and how victims are fighting back.
How Edvardas Kuprenas Fooled Business Leaders Around the World.pdfnathaniel leonard
Recent energy efficiency trends in the EU
1. Odyssee-Mure webinar series on Energy Efficiency
organised by Leonardo ENERGY
November 30th, 2021
Bruno Lapillonne, Laura Sudries – Enerdata
with Estelle Payan - Enerdata
Recent energy efficiency
trends in the EU
2. ▪ This webinar is organized in the framework of the ODYSSEE-MURE project,
that is supported by the H2020 programme of the European Commission.
The project is coordinated by ADEME, with the support of Enerdata and
Fraunhofer-ISI. www.odyssee-mure.eu
▪ The webinar relies on data and energy efficiency indicators prepared in the
framework of the project and disseminated in a database, called
ODYSSEE, and in 5 data tools.
▪ ODYSSEE covers 31 countries*. It is updated up to 2019 from national
sources and completed by Enerdata with early estimates for 2020**.
▪ EU corresponds to EU27 (i.e. without the UK)
2
* 27 EU Member States + UK, Norway, Serbia and Switzerland
** See methodology at https://www.odyssee-mure.eu/publications/other/early-estimates-
methodology.html
Recent EE trends in EU
About
3. Outline
▪ Energy consumption trends
▪ Energy efficiency trends by end-use
▪ Energy efficiency trends by sector
▪ What can we say on energy efficiency in 2020?
▪ Conclusions
3
Recent EE trends in EU
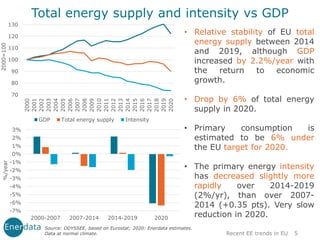
5. • Relative stability of EU total
energy supply between 2014
and 2019, although GDP
increased by 2.2%/year with
the return to economic
growth.
• Drop by 6% of total energy
supply in 2020.
• Primary consumption is
estimated to be 6% under
the EU target for 2020.
• The primary energy intensity
has decreased slightly more
rapidly over 2014-2019
(2%/yr), than over 2007-
2014 (+0.35 pts). Very slow
reduction in 2020.
Total energy supply and intensity vs GDP
Source: ODYSSEE, based on Eurostat; 2020: Enerdata estimates.
Data at normal climate. 5
Recent EE trends in EU
70
80
90
100
110
120
130 2000
2001
2002
2003
2004
2005
2006
2007
2008
2009
2010
2011
2012
2013
2014
2015
2016
2017
2018
2019
2020
2000=100
-7%
-6%
-5%
-4%
-3%
-2%
-1%
0%
1%
2%
3%
2000-2007 2007-2014 2014-2019 2020
%/year
GDP Total energy supply Intensity
6. • Between 2014 and 2019, total energy supply increased less than final
consumption: 17 Mtoe compared to 36 Mtoe.
• This lower progression was explained by changes in the power mix, with:
• A higher share of renewables (+4 pts) and a lower share of nuclear (-2 pts)
and thermal (-2 pts) that reduced total energy supply increase by 18 Mtoe.
• An improved efficiency of thermal generation (+2.2 pts) with a shift from coal
to gas, which contributed to a reduction of 19 Mtoe.
• In 2020, a similar phenomenon occurred: total energy supply decreased more
than final consumption because of an increased penetration of solar and wind (+4
pts).
6
Drivers of total energy supply variation over 2014-2019
Total energy supply vs final consumption
Recent EE trends in EU
Source: ODYSSEE Decomposition tool
1396
+ 36
+ 9
- 19
- 18
+ 7
+ 2
- 1
1412
1350
1400
1450
2014 Var. final
cons.
Electricity
penetration
Efficiency
thermal
power
plants
Power mix Var.
ambient
heat
Other
transf.
Non energy
uses
2019
Mtoe
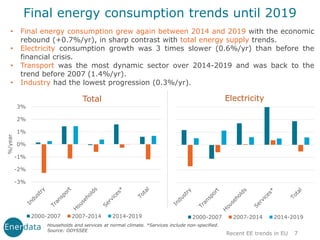
7. • Final energy consumption grew again between 2014 and 2019 with the economic
rebound (+0.7%/yr), in sharp contrast with total energy supply trends.
• Electricity consumption growth was 3 times slower (0.6%/yr) than before the
financial crisis.
• Transport was the most dynamic sector over 2014-2019 and was back to the
trend before 2007 (1.4%/yr).
• Industry had the lowest progression (0.3%/yr).
Recent EE trends in EU 7
Total Electricity
Final energy consumption trends until 2019
-3%
-2%
-1%
0%
1%
2%
3%
%/year
2000-2007 2007-2014 2014-2019 2000-2007 2007-2014 2014-2019
Households and services at normal climate. *Services include non-specified.
Source: ODYSSEE
8. • Final consumption dropped by 5.6% in 2020 and electricity consumption by
4.5%.
• Transport was the most impacted sector, due to lock down and travel restrictions
(-11%).
• Services registered the highest decrease in electricity consumption (-7%) due to
massive teleworking and temporary closure of many public-access
establishments (shops, bars, restaurants, etc.).
• Households was the only sector consumption with an increase in consumption
with people staying longer at home (+1.4% for total, +1.9% for electricity).
Source: Enerdata estimates. International aviation excluded. Households and services at normal climate.
Recent EE trends in EU 8
Total Electricity
Impact of 2020 crisis on energy consumption
-12%
-10%
-8%
-6%
-4%
-2%
0%
2%
%/year
10. 10
How is measured energy efficiency progress by
end-use in ODYSSEE?
• Energy efficiency progress is measured by end-use or sub sector
with various indicators of specific consumption measured in
physical units selected to be as as close as possible to energy
efficiency:
• For transport in l/100 km or koe/pkm for cars, in l/100 km and
koe/tkm for trucks, etc.
• For households in toe/m2 for heating, in kWh/appliance for
large appliances, in toe/dwelling for cooking or water heating,
etc.
• For industry in toe/ton for energy intensive products (steel,
cement, pulp and paper), in toe/IPI for other branches.
• Trends observed for three end–uses will be presented now: cars,
household space heating and large appliances.
• More indicators can be found in the “key indicator tool” at
https://www.indicators.odyssee-mure.eu/online-indicators.html
Recent EE trends in EU
11. Energy efficiency trends of new cars
11
0
1
2
3
4
5
6
7
8
9
l/100km
2000 2014 2019
• Reduction in the specific consumption of new diesel and gasoline cars
until 2014 (1.8%/yr).
• Reverse trend since then in most countries and net slowdown in the
others, due to two main factors: a decrease in diesel share (-20 pts at
EU level) and a growing share of SUV (+ 15 pts).
• Much lower efficiency progress for the car stock, in koe/pkm (0.3%/yr),
for several reasons: biofuels, occupancy rate and real driving conditions
(actual l/100 km higher than test values).
Source: ODYSSEE, based on test specific emissions from EEA
Specific consumption of new cars (test values)
Recent EE trends in EU
12. Energy efficiency of household heating?
12
Recent EE trends in EU
• The specific consumption per m2 for households heating has decreased rapidly in
almost all countries since 2000 (-1.7%/year on average in the EU).
• This trend has significantly slowed down since 2014 at EU level (-0.6%/yr vs -
2.1%/yr before), and in several large countries (e.g. France, Netherlands), with
even a reversal in Germany; this may come from several factors:
• Less new construction (-30% since financial crisis), which only represents
each year 0.9% of the stock (i.e. only 9% of new stock after 10 years);
• Quality of renovations and construction
• Slower diffusion of efficient heating modes (condensing boiler)**
• Rebound effect?
Unit consumption per m2 for space heating for largest consumers*
Source: ODYSSEE based on national data
* Countries representing 75% of the EU heating consumption of households (60% for the 4 largest).
** Penetration of efficient heating modes at https://www.indicators.odyssee-mure.eu/market-diffusion.html
-4%
-3%
-2%
-1%
0%
1%
%/year
2000-2014
2014-2019
13. 13
Recent EE trends in EU
Energy efficiency trends: large households
appliances
• The specific consumption of large appliances (measured in kWh per appliance)
has decreased steadily since 1990 by the labelling and eco-design regulations.
• Efficiency gains are above 40% (i.e. ~2%/year) for refrigerators, washing
machines, dish washers and dryers; for freezers, gains are lower, around 37%.
Source: ODYSSEE, based on national data
Specific energy consumption of large appliances (EU average)
50
55
60
65
70
75
80
85
90
95
100
1990
1991
1992
1993
1994
1995
1996
1997
1998
1999
2000
2001
2002
2003
2004
2005
2006
2007
2008
2009
2010
2011
2012
2013
2014
2015
2016
2017
2018
2019
1990=100
Refrigerators Freezers Washing machines Dishwashers Dryers
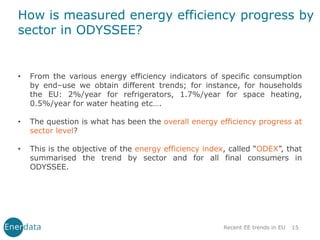
15. 15
How is measured energy efficiency progress by
sector in ODYSSEE?
• From the various energy efficiency indicators of specific consumption
by end–use we obtain different trends; for instance, for households
the EU: 2%/year for refrigerators, 1.7%/year for space heating,
0.5%/year for water heating etc….
• The question is what has been the overall energy efficiency progress at
sector level?
• This is the objective of the energy efficiency index, called “ODEX”, that
summarised the trend by sector and for all final consumers in
ODYSSEE.
Recent EE trends in EU
16. How is calculated ODEX?
• ODEX is calculated:
o First, by expressing trends in specific energy consumption by
end-use (or sub-sector), as an index of variation;
o Then by calculating an average index for the sector weighted by
the share of each end-use (or sub-sector) in the sector’s energy
consumption.
• ODEX is presently calculated on the basis of ODEX is presently
calculated on the basis of up to 40 sub-sectors (8 modes in transport, 11
end-uses for households, 14 branches in industry, 6 branches in
services).
• The use of index of variation by end-use (or sub-sector) enable to
mix specific consumption indicators expressed in different physical
units so as to be as close as possible to energy efficiency (e.g. for
household: toe/m2 for heating, kWh/dwelling for lighting, kWh/appliance
for appliances and cooling, toe/household for water heating and cooking).
16
*For more information on ODEX: https://www.odyssee-mure.eu/publications/archives/odex-
indicators-database-definition.html
Recent EE trends in EU
17. ▪ The energy efficiency progress of final consumers, as measured with ODEX, has
slowed down from 1.2%/yr over 2000- 2014 to 0.7%/yr since 2014.
▪ Households is the sector with the greatest progress since 2000, however with
improvements twice lower since 2014.
▪ Strong slow down in industry since 2007 (0.8%/yr; down from 1.6%/yr before).
▪ Lowest improvement in transport, with also a progress twice lower since 2014
(0.4%/yr) than over 2007-2014, because of the slower progress for cars.
▪ Larger gains for services since 2010 (1%/yr for services over 2014-2019).
Energy efficiency improvements for final consumers (EU)
17
Declining progress in most sectors since 2014
Recent EE trends in EU
Source: ODYSSEE, measured with ODEX (Odyssee Energy Efficiency Index).
ODEX=81.3 in 2019 ➔ 18.7% energy efficiency improvement since 2000
70
75
80
85
90
95
100
2000 2002 2004 2006 2008 2010 2012 2014 2016 2018
2000=100
Industry
Transport
Households
Services
Total
18. • Energy savings represented 21% of final energy consumption in 2019:
without savings final consumption would have been 21% higher.
• Since 2014, these savings have been twice lower for transport and
households.
• Households were overrepresented, with a share of total savings 50%
higher than their share in consumption (44% vs 27%) while savings in
transport were twice lower than their share in consumption (15% vs
31%). This is explained by the high number of measures for households.
% in energy savings
% in final consumption
18
Energy savings vs. consumption
0
20
40
60
80
100
120
140
160
180
200
2000
2001
2002
2003
2004
2005
2006
2007
2008
2009
2010
2011
2012
2013
2014
2015
2016
2017
2018
2019
Mtoe
Industry Transport Households Services
28%
31%
27%
14%
31
%
15
%
44
%
10
%
Recent EE trends in EU
Source: ODYSSEE; cumulated annual energy savings since 2000;
https://www.indicators.odyssee-mure.eu/energy-saving.html
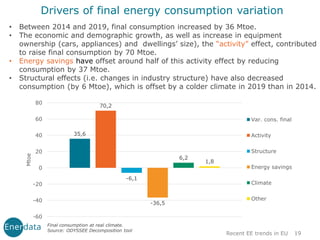
19. 19
Drivers of final energy consumption variation
• Between 2014 and 2019, final consumption increased by 36 Mtoe.
• The economic and demographic growth, as well as increase in equipment
ownership (cars, appliances) and dwellings’ size), the “activity” effect, contributed
to raise final consumption by 70 Mtoe.
• Energy savings have offset around half of this activity effect by reducing
consumption by 37 Mtoe.
• Structural effects (i.e. changes in industry structure) have also decreased
consumption (by 6 Mtoe), which is offset by a colder climate in 2019 than in 2014.
35,6
70,2
-6,1
-36,5
6,2
1,8
-60
-40
-20
0
20
40
60
80
Mtoe
Var. cons. final
Activity
Structure
Energy savings
Climate
Other
Recent EE trends in EU
Final consumption at real climate.
Source: ODYSSEE Decomposition tool
20. What can we say on energy
efficiency in 2020?
Recent EE trends in EU
21. Energy efficiency in a period of recession: some
reminders
• In general energy efficiency deteriorates in periods of deep
recession in productive sectors (industry, services and freight
transport): indeed, energy consumption does not follow the
reduction in economic activities because of lower use of industrial
capacities, or lower load factor for trucks, leading to an increase of
indicators of specific consumption and a lower “efficiency”, not from
a technical viewpoint but from an operational viewpoint.
• The same applied in 2020 for public passenger transport (train,
metro, bus), as lock down and sanitary measures have led to a
sharp reduction in traffic and load factors, but less in industry and
freight transport that were less affected than for instance in the
2009 recession.
Recent EE trends in EU 21
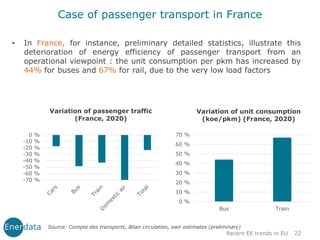
22. Case of passenger transport in France
• In France, for instance, preliminary detailed statistics, illustrate this
deterioration of energy efficiency of passenger transport from an
operational viewpoint : the unit consumption per pkm has increased by
44% for buses and 67% for rail, due to the very low load factors
Recent EE trends in EU 22
-70 %
-60 %
-50 %
-40 %
-30 %
-20 %
-10 %
0 %
Variation of passenger traffic
(France, 2020)
Source: Compte des transports, Bilan circulation, own estimates (preliminary)
0 %
10 %
20 %
30 %
40 %
50 %
60 %
70 %
Bus Train
Variation of unit consumption
(koe/pkm) (France, 2020)
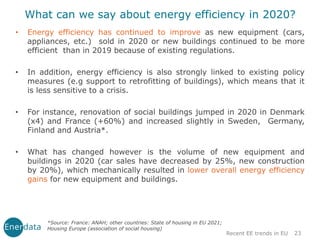
23. What can we say about energy efficiency in 2020?
• Energy efficiency has continued to improve as new equipment (cars,
appliances, etc.) sold in 2020 or new buildings continued to be more
efficient than in 2019 because of existing regulations.
• In addition, energy efficiency is also strongly linked to existing policy
measures (e.g support to retrofitting of buildings), which means that it
is less sensitive to a crisis.
• For instance, renovation of social buildings jumped in 2020 in Denmark
(x4) and France (+60%) and increased slightly in Sweden, Germany,
Finland and Austria*.
• What has changed however is the volume of new equipment and
buildings in 2020 (car sales have decreased by 25%, new construction
by 20%), which mechanically resulted in lower overall energy efficiency
gains for new equipment and buildings.
Recent EE trends in EU 23
*Source: France: ANAH; other countries: State of housing in EU 2021;
Housing Europe (association of social housing)
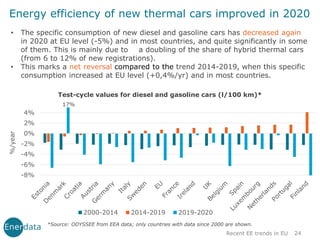
24. Recent EE trends in EU 24
Energy efficiency of new thermal cars improved in 2020
• The specific consumption of new diesel and gasoline cars has decreased again
in 2020 at EU level (-5%) and in most countries, and quite significantly in some
of them. This is mainly due to a doubling of the share of hybrid thermal cars
(from 6 to 12% of new registrations).
• This marks a net reversal compared to the trend 2014-2019, when this specific
consumption increased at EU level (+0,4%/yr) and in most countries.
*Source: ODYSSEE from EEA data; only countries with data since 2000 are shown.
-8%
-6%
-4%
-2%
0%
2%
4%
%/year
2000-2014 2014-2019 2019-2020
17%
Test-cycle values for diesel and gasoline cars (l/100 km)*
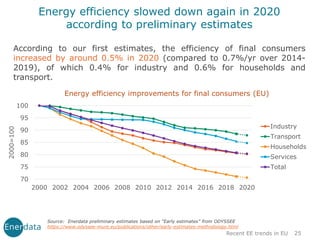
25. According to our first estimates, the efficiency of final consumers
increased by around 0.5% in 2020 (compared to 0.7%/yr over 2014-
2019), of which 0.4% for industry and 0.6% for households and
transport.
Energy efficiency improvements for final consumers (EU)
25
Energy efficiency slowed down again in 2020
according to preliminary estimates
Recent EE trends in EU
Source: Enerdata preliminary estimates based on “Early estimates” from ODYSSEE
https://www.odyssee-mure.eu/publications/other/early-estimates-methodology.html
70
75
80
85
90
95
100
2000 2002 2004 2006 2008 2010 2012 2014 2016 2018 2020
2000=100
Industry
Transport
Households
Services
Total
26. First estimates of the drivers of final consumption
variation in 2020 at EU level
Recent EE trends in EU 26
Source: Enerdata preliminary estimates based on “Early estimates” from ODYSSEE
Drivers of final consumption variation between 2019 and 2020
• In 2020, final consumption decreased by 62 Mtoe.
• Almost all of this decrease is due to the contraction of activity related to the
COVID-19 pandemic.
• Energy savings contributed to a reduction in consumption of 8 Mtoe.
-62
-59
8
-8 -9
6
-70
-60
-50
-40
-30
-20
-10
0
10
20
Mtoe
Var. cons. final
Activity
Structure
Energy savings
Climate
Other
27. First estimates of the drivers of transport
consumption variation at EU level
• In 2020, transport consumption decreased by 33 Mtoe, which is mostly
due to the drop in traffic, especially passenger traffic, which in a normal
year represent around 60% of the consumption .
• Energy savings is estimated to have contributed to a reduction in
consumption of 4.5 Mtoe.
• “Others” factor correspond mainly to increase in specific consumption per
unit of traffic due to the reduction in the rate of occupancy in public
transport .
Recent EE trends in EU 27
Source: Enerdata preliminary estimates based on “Early estimates” from ODYSSEE
Drivers of transport consumption variation between 2019 and 2020
-32,5 -33,2
0,6
-4,5
4,5
-40
-35
-30
-25
-20
-15
-10
-5
0
5
10
Mtoe
Var. cons.
Activity
Modal shift
Energy savings
Other
28. Conclusions
• Over 2014-2019, the growing share of renewables
and natural gas in the power mix has offset part of
the increase in final consumption.
• Energy efficiency improvement of final consumers
has been 40% slower since 2014.
• Over 2014-2019, energy savings offset half of the
effect of economic growth.
• Almost all of the sharp decrease in consumption in
2020 is due to the contraction of activity related to
the COVID-19 pandemic.
• The efficiency of final consumers increased by
around 0.5% in 2020: energy savings had a
marginal effect in the reduction of consumption.
28
Recent EE trends in EU
29. www.enerdata.net
Thank you for your
attention !
Contact:
About Enerdata:
Enerdata is an energy
intelligence and consulting
company established in 1991.
Our experts will help you tackle
key energy and climate issues
and make sound strategic and
business decisions.
We provide research, solutions,
consulting and training to key
energy players worldwide.
Bruno Lapillonne,
Scientific director
bruno.lapillonne@enerdata.net
Laura Sudries,
Energy efficiency project manager
laura.sudries@enerdata.net
29
Recent EE trends in EU