The definitive, peer-reviewed and edited version of this
article is published and can be cited as
Santos, G., Behrendt, H. and A. Teytelboym (2010),
‘Policy Instruments for Sustainable Road Transport’,
Research in Transportation Economics, Vol. 28, N°1, pp. 46-91.
DOI: 10.1016/j.retrec.2010.03.002
Policy Instruments for Sustainable Road Transport
Georgina Santosa*, Hannah Behrendtb, Alexander Teytelboymb
a
Smith School of Enterprise and the Environment, and Transport Studies Unit, University of
Oxford, Oxford, UK
b
Smith School of Enterprise and the Environment, and Department of Economics, University
of Oxford, Oxford, UK
Keywords
Sustainable transport policies. Public transport. Integrated transport policy. Park-and-ride. Social
inclusion. Land use. Walking and cycling. Road construction. Induced traffic. Freight modal shift.
Transport in developing countries. Sustainable rural transport. Teleworking. Teleshopping.
Teleconfrencing. Car sharing. Car clubs. Eco-driving. Education campaigns. Information and education.
Advertising. Family life changes. Research and development. Synergies.
Abstract
Without questioning the fact that to achieve efficiency emitters should pay for the true costs of their
actions (a core principle of economic policies such as pollution taxes), we find sufficient evidence in the
literature to demonstrate that many other policy instruments can be used in combination with taxes and
permits to ensure that the transport needs of the present generation can be met without compromising
the ability of future generations to meet any needs of their own.
The policies and policy aspects considered in this paper broadly fall into three categories: physical
policies, soft policies, and knowledge policies. All three aim to bring about changes in consumers’ and
firms’ behaviour, but in different ways. The first category includes policies with a physical infrastructure
element: public transport, land use, walking and cycling, road construction, and freight transport. We also
consider the particular challenges for mobility in developing countries, and how these may be addressed.
Soft policies, on the other hand, are non-tangible aiming to bring about behavioural change by informing
actors about the consequences of their transport choices, and potentially persuading them to change their
behaviour. These measures include car-sharing and car-pooling, teleworking and teleshopping, ecodriving, as well as general information and advertising campaigns. Finally, knowledge policies emphasise
the important role of investment in research and development for a sustainable model of mobility for the
future.
The main findings can be summarised as follows.
Physical Policies
An increase in the use of public transport, combined with a decrease in the use of private cars, can
reduce traffic congestion and, more importantly, CO2 emissions, as public transport generally causes
lower CO2 emissions per passenger kilometre than private cars. Public transport fares are subsidised in
most places, which can be justified by economies of scale and by the fact that public transport can reduce
total road transport externalities. London, Singapore, Portland and Curitiba are all examples of good
practice at government level, having achieved reliable, frequent and integrated public transport.
Policies to increase public transport use must be part of an integrated policy. Integrated policy refers to
integration across different modes of transport, different government objectives (such as the economy,
health and the environment), considering the needs of different social groups, and coordinating action
between the relevant government institutions. There is evidence that a lack of coordination can jeopardise
the achievement of policy objectives.
A sustainable model for transport policy also requires integration with land use policies. These may be
somewhat limited within the bounds of existing cities, but as cities grow and new cities are built, urban
planners must put more emphasis on land use for sustainable transport in order to reduce congestion and
CO2 emissions. Sustainable land use policy can direct urban development towards a form that allows
public transport as well as walking and cycling to be at the core of urban mobility.
Walking and cycling, which improve general health and produce no tailpipe emissions, constitute an
excellent alternative to motorised transport on short distance trips within towns and cities. The policies
which can incentivise walking and cycling include crime reduction to make streets safer, well-maintained
and clean pavements, attractive street furniture, safe crossings with shorter waiting times, dedicated cycle
paths, showers in offices, and lower speed limits, to name but a few.
Road construction and expansion used to be seen as one of the most promising ways to reduce traffic
congestion. However, in the mid-1990s, the issue was reassessed and it was found that building and
expanding roads, increased, rather than decreased, congestion, and ultimately induced higher levels of
travel demand. The reason for this is that the extra capacity reduces the general cost of travelling and the
less expensive the travel, the more it will be demanded. Regarding freight modal shift, road transport is
much more polluting than rail per tonne-km of goods transported and therefore a shift towards greater
use of rail in freight transport is desirable. Inadequate infrastructure is the main obstacle preventing this
modal shift taking place.
Developing countries face great mobility challenges: rural areas are often extremely poorly connected to
transport infrastructure, such that, in contrast to the situation in developed countries, the benefits of road
construction can strongly outweigh the total costs (including environmental ones). The main challenge,
however, is to develop a solution to the problems arising from the combination of urbanization and
motorization. Integration of transport and land use policy will be key to rising to this challenge.
Soft policies
Car sharing and car clubs can also potentially reduce CO2 emissions, although the aggregate reduction
in congestion and emissions has not been measured with an adequate degree of precision in the literature.
Teleworking and teleshopping can potentially reduce congestion and also CO2 emissions. However,
the evidence for this reduction is rather mixed, as it is unclear whether these measures lead to overall
reductions in road transport.
Eco-driving campaigns aim to inform and educate drivers in order to induce them to drive in a fuelefficient and thus environmentally friendly way. There seems to be some consensus in the literature that
eco-driving could lead to reductions in CO2 emissions of around 10 per cent.
Information and education policies have often been advocated as instruments which may affect
behavioural change. We find in this survey that these types of measures are necessary, but not sufficient
for behavioural change. Advertising and marketing may go a long way in changing peoples’ behaviour.
In California, for example, Kahn (2007) finds the “Prius” effect: the Toyota Prius is preferred by
consumers relative to other similarly green vehicles, probably due to extensive marketing and celebrity
endorsements. Family life changes are also found to trigger changes in behaviour (Goodwin, 1989,
2008). People whose lives are being changed by some important development (birth of a child,
retirement, etc) tend to respond more to changes in the relative attractiveness of different transport
modes. Advertising campaigns promoting a modal shift towards public transport, for instance, may thus
be more successful if targeted at people in the process of important life transitions.
Knowledge policies
Research and Development is crucial for developing sustainable and low-carbon transport for the
future, and it is essential that governments provide incentives to undertake R&D, so that new low carbon
technologies in the transport sector can be demonstrated and applied at a large scale.
Finally, we consider the issue of policy combination and integration. There is evidence that the
combination and integration of policies can lead to positive side effects and synergies.
Policy integration is crucial in order to rise to the challenges we face in moving towards a sustainable
mobility model. We conclude that classical economic policies may successfully be combined with a
number of policy measures discussed in this paper in order to achieve sustainability in transport.
List of abbreviations
ALS - Area licensing scheme
CBD - Central Business District
COBA - Cost-benefit analysis
COE - Certificate of Entitlement
ECMT - European Conference of Ministers of Transport
HOV - High Occupancy Vehicle
IEA - International Energy Agency
LRT - Light Rapid Transit
MRT - Mass Rapid Transit
NATA - New Approach to Appraisal
PTP - Personal Travel Planning
TfL - Transport for London
UK DfT - UK Department for Transport
UNEP - United Nations Environment Program
US DoT - US Department of Transportation
US EPA - US Environmental Protection Agency
1. Sustainable Transport Policy
Part I of this volume highlighted the problem of negative externalities from road transport and
concentrated on economic instruments to address them.
Part II focuses mainly on physical and soft policies1 to reduce CO2 emissions (and consequently climate
change impacts) from road transport. This is the most challenging externality to deal with. Stern (2006,
Chapter 2, p.25) summarises the reasons for this as follows:
Climate change is a global externality, and the marginal cost of CO2 emissions is independent of
where the emissions were produced.
The impacts of global warming are persistent in the long-run.
There is substantial uncertainty regarding the magnitude, type and timing of the impacts from
climate change and the costs of combating it.
There is a risk of irreversible non-marginal changes.
The conventional way in which economics has analysed externalities and has proposed policies to
internalise them does not seem sufficient in the context of climate change. Although the methods are
useful, they tend to focus on marginal changes and ‘can only be starting points for further work’ (Stern,
2006, Chapter 2, p.23).
Without questioning the importance of emitters facing the true costs of their actions we argue that many
other policy measures can be used to complement (rather than substitute) economic policies without any
danger of double-charging or over-shooting - common problems in standard economic analysis of
externalities.
1.1 Sustainable transport policy objectives
The concept of “sustainable development” was defined in Our common future, the final report of the UN
Commission on Environment and Development, chaired by Gro Harlem Brundtland, and published in
1987, as follows: ‘Sustainable development is development that meets the needs of the present without
compromising the ability of future generations to meet their own needs’ (UN Commission on
Environment and Development, 1987, Paragraph 1, Chapter 2). The concept of sustainability is now
present in virtually all spheres of life. Governments around the world continue to attempt to implement
policies that will achieve sustainability in different areas (from energy to urban planning, to transport etc).
In 2005, the number of motor vehicles worldwide exceeded one billion (Sperling and Gordon, 2008,
Figure 2, p.4). The importance of containing the emissions from road transport in order to mitigate the
1 The UK government refers to “soft” policies as “smart” policies. We discuss their meaning below.
impact of human activities on climate change cannot be underestimated. ‘Climate change is the greatest
market failure the world has ever seen’ (Stern, 2006, p.viii).
Reducing or eliminating CO2 emissions in the transport sector will need widespread implementation of
sustainable transport policies, including economic instruments, physical and soft measures, and
technological innovations, without jeopardising the mobility of goods and people.
We argue that physical and soft measures can act as an important complement to standard economic
instruments. Physical policies are infrastructural improvements to road transport, including public
transport and land use2. However, there is no unified, agreed upon, definition of ‘soft’ measures in the
literature (Möser and Bamberg, 2008, p.10). We define soft measures as those initiatives which attempt to
bring about behavioural change by informing the public about the consequences of and alternatives to
their transport choices.
We discuss physical policies, such as public transport and land use measures. These policies have attracted
a fair amount of empirical analysis and, for the most part, we can draw reasonably accurate conclusions
about their effects on the economy, society and the environment.
Even though there is some uncertainty regarding the effectiveness of soft policies, given that the impacts
of many of them have not been quantified, their adoption is widespread. This may be explained by the
fact that these policies do not encounter as much public and political opposition as traditional economic
policies, such as taxes and charges do. Another reason for their popularity is that soft policies, such as
improved driving behaviour, can be cost-effective ways to abate CO2 (McKinsey & Company (2009,
exhibit 3, p.9).
It should be noted, however, that soft measures on their own are unlikely to achieve substantial
reductions in CO2 emissions from road transport. Indeed, their impacts are not only uncertain, but also
likely to be small. The uncertainty arises mainly due to a lack of robust data (UK DfT, 2009a, paragraph
4.32, p.25).
Cairns et al. (2008, Table 1, p.599) for example, summarise the estimated impacts of soft measures from
seven different studies. The estimates vary widely, according to the assumptions made. Thus, studies find
that soft polices may reduce traffic levels by between 4 and 26 per cent (Cairns et al., 2008, p.597). After
reviewing the studies, Cairns et al. (2008) conclude that ‘within approximately ten years, smarter choice
measures have the potential to reduce national traffic levels by about 11 per cent, with reductions of up to
21 per cent of peak period urban traffic’ (p.593). McKinsey & Company (2009, exhibit 1, p.6) estimate
that improving traffic flow and driving behaviour could contribute 8 per cent of the overall road transport
CO2 abatement potential by 2030. Reducing the distance driven could add a further 3 per cent.
2 We discuss subsidies to public transport in Section 2 of the present survey, and subsidies towards cleaner vehicles in Sections 4 and 5 of Part I
of this volume.
Möser and Bamberg (2008), on the other hand, conduct a meta-analysis of 141 studies evaluating soft
policies and find that ‘currently available empirical evidence provides no solid basis for the claim that a
broad implementation of soft transport policy measures is an effective strategy for reducing car use’
(p.19). In general, they argue, studies evaluating soft policies seem to arrive at very optimistic conclusions
on the effectiveness of soft transport policies due to two factors: first, the scenarios on which the studies
are built tend to be based on the results of studies that were not conducted rigorously and second, the
techniques used in these studies for synthesising the trends of the empirical evidence rely on narrative
techniques, such as verbal comparison and discussion, rather than on statistical methods. They conclude
that the extensive use of weak quasi-experimental designs undermines the validity of the reported soft
policy impact (p.19). This validity, they argue, can be further questioned because most studies do not use
statistical tests for rejecting the null hypothesis of no effect and use samples that are not representative of
the total population (p.19). One example they cite as having these shortcomings is Cairns et al. (2004), on
which Cairns et al. (2008) is based.
The UK DfT has recently changed its view regarding the effectiveness of soft measures. Their document
Making Smarter Choices Work (UK DfT, 2005, pp.4-5) reports that ‘nationally, traffic volumes could be cut
by 11 per cent’3. In line with these estimates the UK government committed to providing substantial
funding and support to local authorities for the implementation of soft policies. However, they take a
rather more cautious stand in their Impact Assessment of the Carbon Reduction Strategy for Transport (UK DfT,
2009a). In this document they present a table which clearly reflects how their assumptions changed. The
assumption that car-trips and car-km will be reduced by 11 per cent by the year 2020 is replaced by
estimates of 7 per cent and 3.7 per cent reductions respectively (UK DfT, 2009a, Figure A27, p.103).
They argue that their analysis has been updated to be more realistic and they now assume that soft
measures only have impacts in urban areas, as there are fewer alternatives to the car in rural areas (UK
DfT, 2009a, paragraph 4.31, p.25).
In the sections that follow we discuss the rationale behind different physical and soft policies, look for
examples where they have been implemented and, subject to data availability, summarise the evidence for
their success or failure.
3 UK DfT (2005) is entirely based on Cairns et al. (2004), as pointed out throughout the document and explicitly acknowledged o n the last page.
Physical Policies
2. Public transport in the context of an
integrated transport policy
Public transport, which can be defined as transport available to the public, charging set fares and running
on fixed routes, has been and continues to be advocated as one of the solutions that may help reduce the
different road traffic externalities. Although public transport also imposes negative externalities of the
type discussed in Part I of this volume, their impact tends to be lower, compared to that from cars.
Public transport includes a number of possible alternatives, and can be urban or inter-urban and run on
dedicated or shared facilities. It can consist of railways (underground, light rail, high speed rail, interurban rail), buses, and even ferries that use rivers running across cities and towns. The services are usually
provided by the local or regional authority or managed by the authority (setting routes, frequencies, and
monitoring service quality) but operated by private companies, usually under contract with the local or
regional authority.
Public transport offers a number of different benefits, which can be broadly categorised as economic,
environmental, and social. We discuss these in the context of an integrated transport policy.
2.1 Integration
The phrases ‘integrated transport’ or ‘integrated transport policy’ are used extensively in transport
research papers and government publications. Yet, their meaning is broad and they have been used in
different contexts.
In the UK, the former Department of the Environment, Transport and the Regions (DETR), currently
Department for Transport (DfT), published a consultation document in 1997, entitled Developing an
Integrated Transport Policy (UK DETR, 1997), which was followed by a White Paper, entitled A new deal for
transport: better for everyone (UK DETR, 1998). In these documents, ‘integrated transport policy’ meant:
Integrated in the sense of integrating the different modes of transport (easy and reliable
connections, shared - card or payment - technologies and timetables).
Integrated in the sense of planning land use and making transport policies consistent with
objectives in the areas of environment, health, the economy and society in general. Land use
policy and its integration with transport policies is discussed in Section 3.
Integrated in the sense of integrating all social groups (including the disadvantaged and those
with impaired mobility).
Integrated in the sense of cooperation amongst all relevant institutions and policymakers.4
The White Paper (UK DETR, 1998) even created the Commission for Integrated Transport, which
provides independent advice to the Government on integrated transport policy until this day.
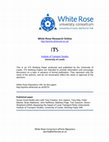
Figure 1 summarises the dimensions of transport policy integration.
Figure 1: Dimensions of transport policy integration
Whatever definition is chosen, the underlying common denominator is that a successful transport policy
must be internally consistent (combining different modes of transport), as well as consistent with, and
supporting government objectives in policy areas other than transport. In this sense public transport
undoubtedly needs to be integrated.5
4 This bullet point was not included in UK DETR (1998) but has been added by us.
5 Schäfer et al. (2009) note that ‘choosing policy measures… requires weighing a set of sometimes conflicting concerns, such as CO2 emissions,
other environmental effects, safety, oil security, tax revenue, competitiveness of domestic firms, and consumer impact’ (pp.251-252).
2.1.1 Physical integration of different modes of transport
Different modes of transport can be integrated in a multitude of ways, and we may distinguish broadly
between non-physical measures of integration and physical interchange facilities (UK Commission for
Integrated Transport, 2000). Non-physical measures for integrating different modes of public transport
include for instance integrated tickets such as travel-cards and provision of information about interchange
options. The UK Commission for Integrated Transport (2000) thus notes in its report on physical
integration that increasing the availability of comprehensive information is vital to making multi-modal
journeys more attractive to travellers. Providing real time travel information, in particular, is considered
an important factor in making public transport a more attractive option relative to the car (UK
Commission for Integrated Transport, 2000). Research by Kenyon and Lyons (2003) indicates that if
multimodal traveller information is to influence people’s modal choice, it must be fully integrated. Such a
system would provide the user with easily comparable information regarding, for instance, the costs and
journey times of different transport options available. A fully integrated multimodal traveller information
system thus displays information on different public transport alternatives together with comparable
information for a car journey (Lyons and Harman, 2002).
Integrated ticket systems, which avoid imposing costs on passengers making multi-modal journeys due to
additional ticket costs or waiting time, are also considered an important factor in encouraging public
transport to be perceived as a network (UK Commission for Integrated Transport, 2000). Abrate et al.
(2009) study a sample of 69 local public transport operators in Italy over the 1991-2002 period, and find
evidence that introducing integrated tariff systems has a positive impact on the demand for public
transport. Public transport policy in Madrid is also considered a successful example of integration: Matas
(2004) notes that in the public transport reform, integrating the fare system in 1987 through the
introduction of a travel card for the entire public transport system was of particular importance. The
travel card system is thus found to have increased bus trips by more than 7 per cent and underground
trips by almost 15 per cent - results similar to those reported for the introduction of integrated fare
schemes in German and Swiss cities, though not as high as those estimated for London (Matas, 2004).
Integrated and technologically advanced ticket systems such as smartcards (the Oyster Card in London,
for example) have the additional benefit of being quicker to read than magnetic paper tickets and can thus
help reduce boarding times for buses and increase the throughput of passengers at busy underground
stations (UK House of Commons Select Committee on Transport, 2008).
For passengers making multi-modal journeys, public transport interchange facilities are also important, as
interchanges affect reliability and total journey time (Eddington, 2006). Passengers tend to perceive
interchange to be a negative aspect of travelling by public transport (Hine and Scott, 2000). Travel by rail,
in particular, is usually part of a multi-modal journey. For rail travel to constitute a viable alternative to the
car, it is vital that interchange between transport modes is seamless: Givoni and Rietveld (2007) thus find
that ‘by improving the accessibility to railway stations, railway use could be increased’ (p.357). A number
of countries in the EU have focussed on establishing multi-modal airports, by connecting airports to citycentres by rail, tram and high-speed rail links (Janic and Reggiani, 2001).
2.1.1.1 Park-and-ride
Park-and-ride facilities integrate private and public modes, by providing parking facilities on the outskirts
of towns and cities, combined with some type of public transport connection, such as bus-stops. The
private mode of transport used tends to be the car, however, ‘cycle storage facilities are also common,
either alongside car parking or exclusively with “bike and ride” schemes’ (Meek et al., 2008, p.781). A
number of different modes of public transport have been integrated into park-and-ride facilities, such as
light and heavy rail, existing bus networks or, more commonly, dedicated bus services. Also park-and-ride
is ‘used as an interchange facility for ridesharing’ (Meek et al., 2008, p.781). Park-and-ride sites are usually
run by the local authority and parking is typically free or substantially less expensive than parking in the
city centre. Buses on the other hand, are either provided by the local authority or by private companies.
The UK Commission for Integrated Transport (2000) notes that, as the car will remain central to the
transport system for the near future, integrating the car with the public transport system is essential. Parkand-ride schemes can play a key role here, as they can induce drivers not to use their cars for the final and
most congested leg of their journey.
Marshall and Banister (2000), studying the bus based park-and-ride scheme introduced in Bristol, for
example, find that the scheme has been successful to some extent in encouraging people to switch from
using private cars to public transport. The study finds that the park-and-ride scheme may have decreased
the number of car journeys into the centre of Bristol by over 500 per day. Over half of the park-and-ride
users would otherwise have just used their private car. While there is thus evidence for park-and-ride
resulting in a modal shift away from the car there is also evidence of trip generation (Marshall and
Banister, 2000). Parkhurst (2000) notes that the main benefit of park-and-ride schemes lies in the
redistribution of traffic away from city centres: park-and-ride schemes are thus ‘particularly valuable
where urban congestion and/or air pollution problems are acute’ (Parkhurst, 2000, p.171). Park-and-ride
facilities have also been employed to improve access to rail stations for inter-urban journeys. In the UK,
for instance, Parkway stations have been established as a way of making the rail network more accessible
to cars. By 1999 there were 13 such facilities, acting as ‘a convenient out-of-town station for inter-urban
rail journeys’ (Lythgoe and Wardman, 2004, p.126), combining good road access and parking facilities
with an attractive rail service. Located outside the city centre, strategically located Parkway stations can
cover a larger catchment area than central rail stations and may be expected to induce a modal shift
towards using rail transport (Lythgoe and Wardman, 2004, p.128).
Park-and-ride has also been popular in the US, with most urban areas introducing such schemes,
encouraging use of public transport or providing ridesharing facilities in order to reduce congestion (US
EPA, 1992, in Meek et al., 2008, p.781). Turnbull et al. (2008) present an overview of the effects of parkand-ride as well as park and pool schemes (provision of parking to facilitate car pooling). Changes in
parking supply at rail stations, for instance, were found to shift commuters from private cars to commuter
rail services in New Haven and South Norwalk. In the Houston Metropolitan area a combination of
extensive park-and-ride as well as park-and-pool facilities together with a system of high occupancy
vehicle (HOV) lanes6 has been implemented in order to reduce traffic congestion and improve mobility.
Surveys conducted after the introduction of the scheme indicated that almost half of the users of the
park-and-ride facilities had previously driven into Houston alone (Turnbull et al., 2008).
2.1.2 Integration with economic, environmental and health policies
Integrated transport policy as defined above is also closely linked to the idea of sustainable mobility,
where sustainability tends to be defined along three dimensions: the economic, environmental and social
(or equity) dimensions (European Commission, 2008a, p.12). Stead (2008) highlights the importance of
integrating transport with environmental and health policies. Banister (2008) notes that consistency
between policy measures and integrated policy-making across different sectors is a key element in making
sustainable mobility publicly acceptable. In this section we will therefore proceed by considering how
transport policy can be integrated with policy-makers’ objectives in the areas of economics, the
environment, and health.
Policymakers both at national and the European level are concerned with integrating transport and
economic policies (European Commission, 2008a, Eddington, 2006). Improvements in passenger
transport in particular can lead to time savings and increase the reliability of transport and impact on
productivity through the presence of agglomeration economies 7 (Eddington, 2006). Reducing congestion
at peak-times can have a positive impact on labour supply, by reducing the costs of commuting (Parry and
Bento, 2000, p.89). In the developed world, as well as in developing countries, economic growth requires
mobility: thus, the UNEP notes that ‘public transport plays a vital role in enabling this growth and is the
backbone of sustainable urban transport systems in many cities all over the world’ (UNEP, 2006, p.53)
Environmental and health policies also need to be strongly linked to transport - a fact that has
increasingly become recognised by policymakers (Stead, 2008). Transport adversely affects the
environment due to the atmospheric, air and water pollution as well as the waste it generates and the
infrastructure it requires. Traffic accidents, environmental pollutants, and noise due to transport adversely
affect health (Stead, 2008). Cleaner air has a positive impact on people’s health and this may have
feedback effects on the demand for healthcare (Parry and Bento, 2000, p.89).
Integrating transport with environmental and health policy is thus important due to the many ways in
which transport affects both health and the environment. Thus, in 2002 the Transport, Health and
Environment Pan-European Program was created in order to integrate transport policy with
environmental and health concerns (Stead, 2008). The environmental effects of transport have become
central to European transport policy - the White Paper European Transport Policy for 2010: Time to Decide, for
instance, aims to promote sustainability in transport policy from an economic, social and environmental
point of view (European Commission, 2001, 2008b).
6 HOV lanes are described in Section 5 of Part I of this volume. As their name indicates these are facilities which can only be used by vehicles
that have two or more occupants (sometimes the minimum requirement is three occupants).
7 Agglomeration economies are briefly explained in Section 1 of Part I of this volume. They essentially refer to the benefits that economic agents
obtain when locating near each other. The concept applies both to firms within the same industry and in different industries.
2.1.2.1 Focus on the role of public transport in reducing CO 2 emissions
The European Commission finds that in order to mitigate the environmental problems associated with
transport, there must be changes in transport operating practices and transport behaviour (in the shortrun through mode switching, as well as through changes in land use planning in the long-run) in addition
to ‘significant research and development of new transport technologies’ (European Commission, 2008b,
p.9).
Public transport can play a role in reducing the problems related to several transport externalities: in
general, accidents and traffic congestion decrease the higher the use of public transport. Eddington (2006)
thus notes that ‘public transport interventions can reduce congestion through providing incentives for
modal shift from cars’ (p.183). The most important benefit, however, is the reduction in harmful
emissions, and in particular, in CO2 emissions. Public transport generally produces much lower CO2
emissions per passenger kilometre than private cars: while petrol- and diesel-fuelled passenger cars emit
130.9 and 124.2 grams of CO2 per passenger kilometre respectively, the CO2 emissions from bus and
coach journeys per passenger kilometre are 89.1 grams, and rail is the least emission intensive travel
mode, causing emissions of only 60.2 grams of CO2 per passenger kilometre (Gross et al., 2009 using data
adapted from the UK Department for Environment, Food and Rural Affairs, UK DEFRA, 2007). The
figures reported make simplifying assumptions regarding the fuel mix of rail and the vehicle load factors
for all modes of transport. It is crucial to note that estimates of CO 2 per passenger kilometre are sensitive
to these assumptions.
A more detailed breakdown of different types of modes of transport is undertaken by Kemp (2007) in a
study for the UK Rail Safety and Standards Board. Kemp (2007) compares different modes of passenger
transport on the main-line network (excluding urban transport systems) in terms of their emissions of
CO2 per passenger. The study finds electric trains and Megabus type intercity buses to be the least
polluting means of transport (emitting around 50 grams of CO 2 per passenger kilometre or less),
concluding that there is strong evidence on environmental grounds for inducing passengers to substitute
from road and air travel to electric railways.8 Diesel-powered trains and private cars, however, do not
differ significantly in terms of their CO2 emissions per passenger kilometre, and given the increasing fuel
efficiency of cars the study predicts that the difference between these modes of transport in terms of CO 2
emissions will become negligible. The study thus finds a strong case for further electrification of railways
on environmental grounds. Givoni et al. (2009) also emphasise that a mode shift to rail should be
considered environmentally beneficial, but that the degree of this benefit depends on the type of train
substituting private cars. Diesel trains are found to emit 69 grams of CO2 per passenger kilometre,
whereas electric trains only emit 54 grams. Both types of train achieve a similar load factor (calculated as
passenger kilometres per vehicle kilometre), suggesting that ‘the differences between the two types of
trains in CO2 emissions per passenger-km are the result of their operational/technological differences and
not due to demand differences on the routes they operate’ (Givoni et al., 2009, p.73). The paper notes,
however, that the desirability of new high-speed train lines depends on the extent to which this would
result in a shift of demand away from car and plane to rail, rather than in new demand.
8 It should be noted that this result is only valid if the electricity on which the train runs has been generated, at least par tly, in a clean way.
Chester and Horvath (2009) make a case for comparing the life-cycle energy use and emissions of
different modes of transport. In addition to tailpipe emissions, their comparison of different modes of
transport in the US thus also accounts for energy use and emissions from vehicle production,
infrastructure, and fuel production. The study finds that greenhouse gas emissions from rail transport are
more strongly influenced by non-operational components than for road transport. Even when accounting
for non-operational components, however, both light and commuter rail are found to generate
significantly less greenhouse gas emissions per passenger kilometre than private cars. Considering urban
diesel buses, the sensitivity of per passenger kilometre CO 2 emissions to occupancy rates becomes
apparent. An urban diesel bus off peak emits more than 400 grams of CO 2 per passenger kilometre, while
the same bus at peak emits around 50 grams, making the urban diesel bus both the worst and best
performing mode of transport in terms of greenhouse gas emissions, depending on occupancy rates.
Public transport policy thus, undoubtedly, has a role to play in bringing about reductions in CO 2
emissions from passenger transport.
2.1.3 Achieving social inclusion through integrated transport policy
The importance of the role of public transport for social inclusion is widely recognised - in the UK there
is a Social Exclusion Unit at Cabinet level and the Department for Transport is also concerned with the
problem of social exclusion: in 2006, for instance the UK Department for Transport commissioned a
study of the transport aspects of social inclusion (MacDonald, 2006). But what is social inclusion or
exclusion? Kenyon et al. (2002) note that there are many definitions of this concept, and argue that social
exclusion should be defined as:
‘The unique interplay of a number of factors, whose consequence is the denial of access, to an individual or
group, to the opportunity to participate in the social and political life of the community, resulting not only in
diminished material and non-material quality of life, but also in tempered life chances, choices and reduced
citizenship.’ (Kenyon et al., 2002, p.209).
Social exclusion thus combines both material and non-material constraints upon individuals, which
prevent them from fully participating in society. Kenyon et al. (2002) identify mobility as being one of the
multiple dimensions of social exclusion, amongst other dimensions such as for example the economic
(income poverty, unemployment), societal (crime, poor education), and personal (health, gender,
ethnicity) dimensions. Public transport can play a key role in addressing the transport dimension of social
exclusion, as the groups most likely to be disadvantaged in terms of transport tend to be those social
groups that generally have less access to cars: people on low incomes, the elderly and disabled, as well as
women and children (Hine and Grieco, 2003). Studies also find that public transport policy can play an
important role in labour market inclusion. For example, Cebollada (2009) finds that the mobility model of
the Barcelona Metropolitan Region, which is in many areas predominantly car-based, discriminates
‘against non-car users when it comes to job opportunities’ (p.226).
In the UK, a study by the Social Exclusion Unit in 2003 ‘collated a wide-body of research evidence to
demonstrate that transport and land-use policies in the UK have interactively worked to systematically
create and reinforce social exclusion’ (Lucas, 2006, p.802). As a result of social exclusion many people are
unable to access various important services and activities such as education and jobs, healthcare, food
shopping, and leisure activities. The report finds that social exclusion is reinforced by the location of
these services and a lack of adequate transport provision. The main problems relating to accessibility are
summarised as follows:
‘Work: Two out of five jobseekers say lack of transport is a barrier to getting a job.
Learning: Nearly half of 16–18-year-old students say they find their transport costs hard to meet.
Health: Over a 12-month period, 1.4 million people miss, turn down or choose not to seek medical help because of
transport problems.
Food shopping: 16 per cent of people without cars find access to supermarkets hard, compared with 6 per cent of people
with cars.
Social activities: 18 per cent of non-car owners find seeing friends and family difficult because of transport problems,
compared with 8 per cent of people with access to a car’ (UK Social Exclusion Unit, 2003, p.9).
The report identifies five key barriers to accessing services. The availability or accessibility of transport is
the first barrier, as some people may not have any adequate public transport available to them, a problem
particularly affecting the disabled, or people living in rural areas without access to a car. The cost of
transport is another barrier to access, as is the location of services in poorly accessible places and the
unwillingness of some people to travel long distances to reach them. Safety and security concerns also
impact on accessibility, as some people are ‘unwilling to use public transport or walk to key services
because of fear of crime or antisocial behaviour, or fear of road accidents’ (UK Social Exclusion Unit,
2003, p.3). 53 per cent of women, for instance, do not feel safe waiting for a train after nightfall.
Another dimension of the issue, in addition to accessibility, is the fact that socially excluded areas and
individuals are disproportionately affected by the problems associated with road traffic, such as
‘pedestrian accidents, air pollution, noise and the effect on local communities of busy roads cutting
through residential areas’ (UK Social Exclusion Unit, 2003, p.1). For instance, the likelihood of dying in a
road accident is five times higher for children in the lowest, compared to the highest social class.
While improving public transport may help address some accessibility problems, conventional public
transport may not be suitable to deal with the particular challenge of providing access to rural areas.
There exists poverty and social exclusion both in cities and in the countryside, but the risk of becoming
“transport disadvantaged” is much greater in rural than in urban areas (UK Commission for Integrated
Transport, 2008). However, providing conventional public transport for rural areas is expensive due to
low population densities, and thus there is potential for demand-responsive transport such as subsidised
taxi services in meeting rural transport demand alongside conventional public transport (UK Commission
for Integrated Transport, 2008).
2.1.4 Institutional and administrative integration
Integrated policy-making cannot succeed if the relevant decision-makers are spread across different
institutions that fail to cooperate effectively. Hull (2005) thus emphasises the importance of integrating
transport planning across administrative boundaries (Hull, 2005, p.322). Pedler and Paulley (2000) show
that regional planning is key for achieving coordination and integration of transport and land use planning
both ‘in a horizontal direction (between planning departments and organisations at the local level) and in
a vertical direction (between planning guidance and policy at the national, regional and local levels)’
(Pedler and Paulley, 2000, p.171).
Mobility is vital to people’s lives and transport has impacts along a number of dimensions, be they
economic, environmental, or social. It is thus unsurprising that integration of transport, in all the different
ways that this can be defined, is crucial for successful transport policy.
2.2 Subsidies to public transport
Public transport on a large scale is a phenomenon originating in the 19 th century, a period when public
transport was economically viable without subsidies (Van Goeverden et al., 2006). With growing car
ownership in much of the developing world and a relative increase in labour costs in the second half of
the 20th century, however, governments in many countries decided to subsidise public transport services,
which could not operate otherwise. Parry and Small (2009, p.700) note that ‘passenger fares for public
transportation are in most places heavily subsidized’. Considering the 20 largest public transport networks
in the US (in terms of passenger miles) they find that subsidies for public transport (measured as the gap
between revenues from passenger fares and operating costs) constitute between 29 and 89 per cent of
operating costs for rail services and between 57 and 89 per cent for buses. Subsidies to public transport
can be justified for a number of reasons including the following arguments:
Economies of scale: average cost of providing (passenger miles of) public transport is greater
than the marginal social cost. These scale economies exist in public transport for two reasons
(Parry and Small, 2009):
o Firstly: In providing transport there are fixed costs (such as building tracks and
maintaining stations), which imply that average costs exceed marginal costs. Pricing at
marginal cost would thus lead to a deficit, which would need to be covered by subsidies.
o Secondly, and more importantly: economies of scale arise due to the “Mohring effect”,
first described by Herbert Mohring in his 1972 seminal paper.9 The “Mohring effect” is a
property of public transport systems. When the cost of waiting time is included as an
input to the production of trips, public transport services are subject to economies of
scale (Small and Verhoef, 2007, p.67). As public transport frequencies increase, waiting
time decreases, demand increases, and frequencies increase again. In other words the
“Mohring effect” captures the fact that the access costs or waiting time incurred by
passengers decreases when public transport provision is increased (i.e. more frequent
services and higher route density).
Negative transport externalities: public transport can alleviate urban transport problems such as
congestion and accidents as well as local and global air pollution by encouraging people to use
cars less. Subsidising public transport may thus be a second-best policy tool for addressing these
problems. A first-best solution would be to internalise the costs by appropriate road pricing
(Parry and Small, 2009).
Social: public transport has a social function in making sure that disadvantaged groups, such as
those on low incomes, the elderly, or disabled do not suffer from social exclusion (Van
Goeverden et al., 2006).
9 Needless to say, he did not call the effect “Mohring effect”. It was afterwards that the property became known as “Mohring effect” in his
honour.
Assessing the extent to which current fare subsidies are justified, however, is not straightforward. Parry
and Small (2009) thus note that different studies provide a range of estimates of optimal transport costs
ranging from zero to more than 100 per cent of operating costs. Developing a general framework to
evaluate existing subsidies, Parry and Small (2009) consider the public transport systems of Washington
DC, Los Angeles and London. They conclude that, across transport modes, cities, and periods, fare
subsidies beyond (and often well beyond) 50 per cent of operating costs are in almost all cases welfare
improving at the margin. This is found to be mainly due to the negative transport externalities and
economies of scale, though the relative importance of each of these differs across cases. However, Parry
and Small (2009) also emphasise that the externalities associated with cars are better addressed by pricing
them more directly. Furthermore, they note that there is evidence of increases in wages and other costs
due to public transport subsidies and thus find that ‘the main caveat is that some of the subsidy may be
lost to inefficiency or captured by labor unions’ (p.721).
Parry and Small (2009) acknowledge that their model fails to explicitly account for the fact that a
monopoly provider of public transport may not have very strong incentives to minimise costs. However,
they argue that this problem does not rule out subsidies per se, as it can be addressed by careful design of
the subsidy programs, noting that one solution is to offer ‘user-side subsidies’ that pay the public
transport operators a fixed amount per passenger-mile. For instance, the UK Commission for Integrated
Transport (2009) appears to have acknowledged the need to incentivise public transport operators
through subsidies. The existing Bus Service Operators Grant (BSOG, previously the Fuel Duty Rebate
(FDR)) reimburses bus operators for approximately 80 per cent of the excise duty paid on the fuel
consumed by their fleet. In the long term the Commission thus proposes an incentive per passenger (IPP)
system in order to induce bus operators to put more effort into attracting people to use public transport.
The report (UK Commission for Integrated Transport, 2009) estimates that a subsidy of 11.2 pence per
passenger journey could induce an additional 31.6 million passenger-journeys per year, with estimated
benefits of £93.7 million, outweighing the costs of £30.6 million. Such a scheme would lead to two kinds
of environmental benefits: firstly, by encouraging more people to use the bus rather than private cars, and
secondly by inducing bus operators to introduce more fuel-efficient vehicles as the operators will be
directly exposed to the real price of fuel (UK Commission for Integrated Transport, 2009).
Parry and Small (2009) admit two further caveats of their study: firstly, omission of the burden on the tax
system in general associated with the subsidies, and secondly, omission of distributional considerations.
Regarding the first point, subsidies must be financed, which usually requires raising taxes that lead to
distortions causing efficiency losses. Income taxes, for instance, reduce the incentive for people to work.
However, lower transport costs also have a counteracting effect as they reduce the general price of goods
and services, which raises the real wage and thus the incentive to work. With regard to distributional
considerations, Parry and Small (2009) note that these may provide reasons for raising the subsidy for
high-density bus services, while reducing that for rail services, as the former tends to be heavily used by
people with lower incomes. However, the general view is that there are better ways to address such
distributional concerns (Parry and Small, 2009). Vassallo et al. (2009), considering public transport in the
Madrid Metropolitan Area, also note that transport only constitutes a small part of household
expenditures across income groups, such that distributional concerns ‘are probably not among the most
pressing issues’ (Vasallo et al., 2009, p.262).
2.3 The virtuous circle between congestion charging and public transport
As well as directly reducing congestion, Small (2004) points out that congestion charging 10 produces a
virtuous cycle in shifting motorists to public transport. Shifting people from cars to buses reduces
congestion and allows buses to travel faster; with more customers for both buses and trains, the
frequency of services increases, resulting in a better service and a further increase in demand, taking more
cars off the road.
Small (2004) estimates the effects of the road pricing scheme in London introduced in February 2003,
under which vehicles travelling in daytime central London incur a charge of £5,11 with revenues from the
scheme used to improve public transport. While the direct increase in public transport use from the
scheme is 6 per cent, the virtuous cycle implies that the total increase in public transport use is estimated
at 16 per cent. Half of this 10 per cent difference is found to be due to the increase in speed and fare
reductions, with the other 5 per cent increase resulting from the improvements in service, funded by the
revenues from the congestion charge. Small (2004) notes that, for a congestion charging scheme to work,
it is not necessary to use the net revenues for public transport improvement. The increase in traffic speed
together with the increase in the number of customers is sufficient in itself to finance increases in bus
services while at the same time reducing fares.
2.4 Examples of successful implementation
There are a number of towns and cities in the world where public transport is heavily used. The share of
public transport in commuting trips can indeed be very high. In London, for example, the share of trips
made by public transport between 7:00 a.m. and 10:00 a.m. was 87 per cent in 2002, before the London
Congestion Charging Scheme was introduced, and increased to over 88 per cent in 2003, after the charge
had been implemented, and furthermore to over 89 per cent in 2006 (UK DfT, 2007a, Table 1.6). In
Hong Kong, the share of commuters using public transport was 74 per cent in 1990 (Kenworthy and
Laube, 1999, p.704).
Comparing the percentage of total motorised passenger kilometres by public transport in different cities
in 1990, Kenworthy and Laube (1999) find large differences amongst continents and cities. Wealthy Asian
countries tend to have the highest shares of public transport travel, while the lowest share, of just 0.8
percent is found in the US cities of Phoenix and Sacramento While US cities have higher car ownership
than cities in other parts of the world, the difference in vehicle use is even greater. Vehicle use in US cities
is thus found to be 7.5 times higher than in wealthy Asian ones, while vehicle ownership per capita is only
5 times higher. Kenworthy and Laube (1999) note that this heavy reliance on cars may be due to ‘very
10 Congestion charging is discussed in Part I of this volume. Congestion charges, in theory equal to marginal congestion costs, make drivers bear
the marginal congestion costs they impose on other drivers.
11 At the time Small (2004) wrote the piece the London charge had not yet been increased to £8.
auto-dependent land use patterns and a general lack of viability of other modes because travel distances
are long and activities are not concentrated enough for effective transit or non-motorised modes’
(Kenworthy and Laube, 1999, p.700). A relatively low share of public transport need not, however,
necessarily imply that a certain city is more car-dependent. In Amsterdam, for example, “only” 25 per
cent (the minimum amongst the European cities in this comparison) of commuters use public transport,
however 35 per cent walk or cycle to work in this city (Kenworthy and Laube, 1999). We now turn our
attention to some examples which can be highlighted as good practice, and emphasise the possible
reasons for their success.
2.4.1 London
The net revenues raised from the London Congestion Charging Scheme12 are used entirely to improve
transport facilities in London. The focus has been mainly on bus services: of the £138 million (€153
million, $201 million) raised from the scheme in 2008, £112 million (€124 million, $163 million) was
spent on the bus route network, infrastructure and safety.
The congestion charge in London had an immediate effect on London’s transport. The number of
vehicles entering London in 2007 was 16 per cent lower than in 2002 and the number of cars, minicabs,
vans and lorries (vehicles which must pay the congestion charge) fell by 29 per cent between 2002 and
2007. The number of buses entering London increased by 33 per cent and the number of people using
buses during morning peak hours rose from 87,000 to 113,000 over the same period (Transport for
London, TfL, 2008). We must be careful not to attribute the entire increase in bus use to the congestion
charge. Bus use started increasing steadily in 2000 after a period of stagnation in the 1990s and with the
aid of additional revenue it had simply continued its trend until 2004, when it stabilised again (TfL, 2008,
Figure 5.2).
TfL had predicted that roughly 20,000 commuters would switch from the private car to public transport
during the morning peak as a result of the congestion charge. Of this number, 5,000 were expected to
transfer to the underground, 14,000 to buses, and the remainder, to the rail system. Although bus
ridership increased in line with expectations, underground and rail travel did not (Santos and Shaffer,
2004, p.171). Indeed, most of the drivers who switched from the car to public transport after the London
charge was implemented, switched to the bus, rather than to rail or underground (Jansson, 2008).
The London Congestion Charging Scheme, combined with quality incentive contracts for bus operators
yielded clear bus improvements in 2003, when excess waiting time, defined as the ‘additional’ time that
passengers have to wait for a bus because of disruption to the schedule, decreased by over 30 per cent,
relative to 2002. This excess waiting time was further reduced by a further 18 per cent in 2004, in the
original charging zone (TfL, 2008, p.94). In 2006-07, however, conditions started to deteriorate, and
excess waiting time increased, partly due to the replacement of water pipes in London, which caused and
continues to cause general disruption to traffic. Bus routes in the remainder of Inner London, outside the
12 The London Congestion Charging Scheme is described in Section 5 of Part I of this volume.
charging zone, showed small reductions in excess waiting time of roughly five per cent, in 2007 (TfL,
2008, p.97).
The main benefits from the London Congestion Charging Scheme (as opposed to revenues, which are
just a transfer from road users to the London government) are the time savings and reliability benefits
experienced by road users, including those using chargeable and non-chargeable modes of transport
(Santos, 2008, p.188). TfL (2007, Table 7.2, p.136) estimates these at £223 million per year for the original
charging zone. On top of that there are minor benefits, such as vehicle fuel and operating savings,
accident savings and environmental benefits. There are also some disbenefits, such as charge-payer
compliance costs (the time incurred in paying the charge), and the disbenefit to deterred trips. When all
these are taken into account, the annual total gross benefits amount to £200 million, which combined
with total costs of £88 million, yield an annual net benefit of £122 million, or a benefit-cost ratio of 2.27
(Santos, 2008, p.188).
The Western extension of the London Congestion Charging Scheme, which took place in 2007, does not
appear to have brought significant benefits to bus transport (TfL, 2008, Figures 5.3, 5.6 and 5.7) and, as
both TfL (2005, Table 7.9, p.113) and Santos and Fraser (2006, Table 12, p.294) had predicted, yielded
benefit-cost ratios of between 0.8 and 1.15.
2.4.2 Singapore
Singapore, a small island city-state with one of the highest population densities in the world, has been a
pioneer in transport policy for over 35 years. Despite its world-class transport system, its rail and bus
network operates entirely without government subsidies (May, 2004). How did Singapore manage to
achieve such a remarkable feat? The key lies in recognising problems early on and careful planning.
Singapore introduced a road pricing scheme, called the Area License Scheme (ALS), in 1975 in order to
tackle increasing congestion.13 ALS operated by imposing a variety of charges on private vehicles and
taxis to enter the Central Business District (CBD) at peak hours. ALS had a dramatic, long-term effect on
peak hour congestion: in 1989, after fourteen years in operation, traffic entering the CBD during
restricted hours was 30 per cent below its 1975 level (Lam and Toan, 2006). In 1998 the cumbersome,
manually-operated ALS system was replaced by a more efficient electronic counterpart (Santos et al.,
2004).
Singapore has four main forms of public transport: bus, Mass Rapid Transit (MRT), Light Rapid Transit
(LRT) and taxi, which account for 60 per cent of all daily trips. Most of the services are operated by two
private companies, which are regulated by the Public Transport Council with regard to quality (e.g. airconditioning and seat belts in taxis) and fares. The Council also insists on physical (e.g. MRT-bus-taxi
interchanges) and fare (e.g. smart-card) integration in order to make connections in public transport as
seamless as possible. Although public transport is not subsidised, the government finances over threequarters of the price of replacing operating assets: the operator is only required to pay the historical value
of assets i.e. what they cost in 1987, so that less of an increase in fares is necessary (Santos et al., 2004;
13 The ALS is described in Section 5 of Part I of this volume.
Phang, 2003). The average cost for commuting trips by public transport is less than 2 per cent of
individual income, and therefore very affordable (Lam and Toan, 2006, p.186). Even Singaporean taxis
are very affordable and make up 11 per cent of all travel (Lam and Toan, 2006).
The government continues to be proactive in introducing new technologies in public transport, such as
GPS on buses and taxis, and innovative congestion reducing schemes, such as park-and-ride (Santos et al.,
2004).
In addition to the above, the Singaporean government realised that road expansion only was not going to
be a sustainable strategy for transport in Singapore. Between 1970 and 2005, road length increased from
1,938 km to 3,234 km (Santos et al., 2004), but the number of vehicles per kilometre of road nearly
doubled. The result is that road infrastructure takes up 12 per cent of scarce land today and further
expansion seems almost impossible (Olszewski, 2007). The government has managed to halve private
vehicle ownership growth by introducing ad valorem car duties and ownership taxes, as well as scrappage
schemes (Santos et al., 2004).
2.4.3 Portland
While North America as an area tends to be associated with cars, there are also success stories to report
for cities that have ‘overcome the dominant paradigm of automobile-based planning’ (Newman and
Kenworthy, 1996, p.16). Newman and Kenworthy (1996) note that success stories such as Vancouver,
Toronto and Portland have in common the fact that the community managed to force planners to rethink
their proposals of freeway construction. In this section, we consider the story of Portland, Oregon.
Gibson and Abbott (2002) describe the problems of “urban crisis” that the city faced before the crucial
revitalisation plan of 1972 (the “Downtown Plan”). The city centre, and especially retail, faced a bleak
future with inadequate parking facilities and a bankrupt private bus system, as well as a new superregional shopping centre. Addressing this threat, members from throughout the community started
working together with city officials to develop integrated solutions for the problems faced by the city
(Gibson and Abbott, 2002). Key policies in the 1970s thus included replacing a six-lane riverside freeway
at the edge of the city centre with a waterfront park. Plans for the construction of the Mt Hood
Expressway through the city were abandoned, instead using the federal highway funds to construct a 15mile light rail line (Gibson and Abbott, 2002; Newman and Kenworthy, 1996). Notably, the number of
passenger trips per person using public transport increased by 119 per cent between 1970 and 1980
(Newman and Kenworthy, 1996).
This rail system has since been augmented with several additional light rail lines, including the Portland
Streetcar in 2001 and the Interstate MAX in 2003 (City of Portland Office of Transportation, 2004). The
numerous light rail projects have been supplemented with a limitation of car access and planting of trees
together with the introduction of bus priority streets with high quality bus shelters. Newman and
Kenworthy (1996) also emphasise the role played by the business community in making the streets more
attractive by helping to repave them and by furnishing them with seats, plants and sculptures.
2.4.4 Curitiba
In 1964 the Preliminary Urban Plan, later to become the Curitiba Master Plan, was commissioned by the
public administration of Curitiba (Rabinovitch, 1996). While the integration of land use and transport
policy has since become widely accepted, the Curitiba Master Plan’s integration of these principles was
quite unusual at the time. The integrated approach viewed transport as a system linked to ‘housing, land
use, the road network, commercial development and recreational investments such as parks, green spaces
and the preservation of historic sites’ (Rabinovitch, 1996, p.64).
The transport network started operating in 1974 and is designed as a trunk and branch system. Highcapacity buses serve the “trunks”, i.e. radial express routes from the city centre. Transfer stations at
regular intervals along these lines allow for interchange with the “branches” of the system, i.e. the lowerdemand feeder routes, as well as with the orbital inter-district routes. Interchange does not require extra
payment as tickets are integrated. The system, operated by ten bus companies under the regulation of
municipal authorities, is entirely self-financed (Rabinovitch, 1996).
Curitiba’s bus-based public transport system is characterised by a step-by-step approach of
improvements. Thus, rather than replacing the existing bus system with an underground or rail system,
the first step was to establish an express bus system with dedicated bus lanes. This system, improved and
extended over the years, provides “a high-quality service comparable to an underground system at a much
lower capital cost” (Rabinovitch, 1996, p.64), low costs allowing the system to be financed entirely by
passenger fees.
In the 20 years between 1974 and 1994 the transport network went from carrying 54,000 to around
650,000 passengers per day, with an average of 1.3 million passengers transported daily in 1996
(Rabinovitch, 1996), catering for 75 per cent of the population - one of the highest patronage rates in the
world. Rabinovitch (1996) reports that a survey by the Bonilha Institute (1992, in Rabinovitch, 1996)
finds a modal shift amongst commuters to have occurred, with around 25 per cent of commuters
estimated to have switched from cars to public transport.
Smith and Raemakers (1998) note, however, that while Curitiba is often upheld as a developing country
success story of environmentally sustainable integration of land use and transport policy in a fast-growing
city, this success may not be easy to emulate. The institutional strength, policy co-ordination and in
particular control over land allocation required to copy Curitiba’s success tend to be lacking in other cities
facing similar problems as those successfully tackled in Curitiba.
2.5 Concluding remarks
Public transport plays a central role in building a model of mobility that is environmentally, as well as
socially and economically sustainable. There are a number of reasons for subsidising public transport,
including the fact that public transport can help alleviate transport externalities such as congestion and
pollution, while also facilitating social inclusion. The examples of successful implementation discussed in
this section emphasise a theme running throughout the whole of Part II: successful policies must be
integrated along a number of dimensions. In the next section we thus consider land use policy and its
integration with transport policy.
3. Land use policies
Land use plays an important part in transport policy. In this section we investigate the role of land use in
sustainable transport, with a focus on how land use policies can lead to sustainable mobility. In particular,
we investigate how better urban planning, mixed-use development and road layouts can reduce demand
for private vehicles and increase the use of sustainable modes of transport, while making travel more
reliable, safer, and more pleasurable.
Land use policies are somewhat limited within the bounds of existing cities. But as cities grow and new
cities are built, urban planners must put more emphasis on land use for sustainable transport in order to
reduce congestion and pollution.
Transport on the other hand also has an important effect on land use. For example, building a road near a
brownfield site may create an incentive for someone to redevelop it for residential or commercial
purposes.
A theme which will run throughout this section is the importance of integration of land use and transport
policies. Some of these policies are discussed separately in sections 8 and 10, but we will explain that a
synthesis of these policies is crucial to generating an environment of sustainable mobility.
3.1 Land use policies in existing cities
Existing cities often pose a challenge for applying land use policies for sustainable transport. Entire cities,
such as Budapest, may be preserved by the UNESCO World Heritage Committee because of their
architectural and historic value. Development in these areas can be very controversial: Dresden’s Elbe
Valley was removed from the Heritage List in 2009 after a four-lane bridge was built there. Governments
may also enforce domestic laws and regulation to demolition and modification of certain buildings,
bridges and other structures (e.g. listed buildings in the UK). Therefore land use policy options within
existing cities are more restricted than in newly-developed areas and carry a marginal rather than a
formative character.
3.1.1 Changing the way people travel
A key issue related to land use planning is the potential reduction in travel demand. This, however, is
exceptionally hard to do in an existing city where redevelopment is not possible. If commercial, residential
and shopping areas are taken as given, people must find a way to travel to work or to shop. Hence, the
more efficient way to encourage sustainable transport is to induce a modal shift from car to walking,
cycling and public transport.
3.1.2 Car parking
Parking provision plays a central role in demand for car ownership and journeys. The UK government
has been recommended to limit parking provisions near dwellings and places of employment. However,
people are reluctant to give up car parking spaces associated with properties, even if they do not own a
car, because they perceive a property without a parking space to lose value (Stubbs, 2002). Rye and Ison
(2005) argue that many private-sector employers in the UK meet resistance from employees in the face of
parking charges.
In city centres parking provision may be easier to control than parking charges, especially if car parks are
run by private operators. Copenhagen (see below) reduces the amount of parking in the city centre by 3
per cent every year (Newman and Kenworthy, 1996). A combination of free curb-side parking and car
parks encourages cruising at low speeds to find a spot (74 per cent of cars idle in Freiburg), causes
pollution and congestion and makes pricing policies very difficult (Shoup, 2006). This suggests that
perhaps eliminating free car parking as far as possible is a viable option. Knoflacher (2006) suggests an
integrated solution: providing garaged car-parks at public transport stops at low cost and charging high
rates on domestic parking, which are three to four times higher. This, in his opinion, could render 70 per
cent of urban space car-free. Some of these options can be achieved with little opposition from planning
authorities.
3.1.3 Planning regulations
Planning authorities can also affect transport choices through regulation. The government could give
local authorities the power to force the developer to draw up a sustainable travel plan in order to get
planning permission. Rye (2002) discusses the case of the UK, however, he points out that the
requirements are enforced unevenly. Enoch and Potter (2003) cite studies which suggest that a
comprehensive travel plan for employees prior to development of a site could reduce car trips at peak
time by between 1 and 30 per cent.
Planning regulations on paper do not, however, always have the desired effects in practice. The ABC
policy introduced in the Netherlands in 1988 with the specific objective ‘ to match the mobility needs of
businesses and amenities with the accessibility of different locations’ ( Martens and van Griethuysen,
1999, p.2) is an interesting example. The Dutch authorities rated business locations according to their
accessibility profiles: A locations were well-connected by public transport, B locations were fairly
accessible by both public and private transport and C locations were poorly connected by public
transport, but had good motorway access (Martens and van Griethuysen, 1999; Schwanen et al., 2004).
Local governments were advised to encourage new employment and public services (especially those with
high visitor intensity, such as schools) in A and B locations (van der Burg and Dieleman, 2004).
Unfortunately, the scheme failed to deliver the expected results. Firms felt very constrained by severe
parking space limits (see above) in A and B locations (van der Burg and Dieleman, 2004). Unwilling to
resist growth in office sector employment and constrained by space in A and B locations, local
governments chose to let many new offices locate at C locations (Schwanen et al., 2004). To further
exacerbate the failure, there were severe implementation problems and the local government tended to
exaggerate how accessible by public transport B locations were (Schwanen et al., 2004).
3.1.4 Accessibility
Accessibility, as a concept in land use policy, has a variety of definitions and meanings (see Geurs and van
Wee, 2004, p.128, for a brief review). For our purposes we shall define accessibility as ‘the extent to which
land-use and transport systems enable (groups of) individuals to reach activities or destinations by means
of a (combination of) transport mode(s)’ (Geurs and van Wee, 2004, p.128). As we outline below,
accessibility is a distinctive feature of most sustainable transport policies. Land use policies which make
walking, cycling, and public transport more accessible will reinforce their desirability. Most of these
policies and their effectiveness are, in fact, discussed in sections 8 and 10. Here we want to emphasise
some key points which relate directly to land use.
Integration of all sustainable transport policies is crucial to accessibility. Physical integration, such as
bicycle racks at railway stations, park-and-ride and multi-modal public transport terminals, must be
prioritised in order to ensure that people can optimise their transport schedule over a variety of modes.
Multiple examples of successful physical integration are discussed in sections 8 and 10.
Land use policies which promote public transport must satisfy an important dimension: location. Bus
stops and cycling lanes must be built strategically near residential areas and lead to areas of interest, such
as employment and shopping centres. Kitamura et al. (1997), in their study of travel patterns in San
Francisco bay area, find that private car use is negatively correlated with the distance to the nearest bus
stop and to the nearest park. Easily accessible transport has desirable effects on social inclusion and
labour force participation (Sanchez, 1999).
Land use makes an invaluable and unique contribution to sustainable transport policy, as it can reduce the
overall distance that people need to travel. Thus appropriate land uses policies in existing cities can reduce
aggregate travel demand as well as influence the uses of sustainable transport modes.
3.1.5 Mixed-use development and sprawl containment
Mixed-use development, to any extent that is possible in an existing city would be an excellent land use
policy. Sustainable transport may play a supporting role in that. For example, converting a car park into a
popular pedestrian area, such as Copenhagen’s Nyhavn (see below), may encourage the development of
small businesses, shops and restaurants in residential buildings (see Roberts et al., 2006, Whitehead et al.,
2006, for other examples).
As cities grow, seemingly positive mixed-development and containment land use policies may turn out to
have adverse effects. The Barker Review for the UK government noted:
‘While it had been hoped that this development would result in self-contained towns, the increased availability of
private cars and falling transport costs resulted in greater propensity to travel, so that commuting times increased,
partly as new residential developments were often separated from new employment, leisure and retail activities. This
has led to the ‘jumping’ of green belts, where commuters travel long distances over protected land in order to reach
work, in part due to restrictions in the expansion of those towns and cities themselves. There is also the risk that
brownfield sites rich in biodiversity are developed while areas beyond the city of less environmental value remain
protected’ (Barker, 2006, p.46).
Brownfield sites are often a rare opportunity for urban planners to develop an entirely new structure
within an existing city. One way to develop brownfields would be to incentivise businesses via transport
links, subsidies, etc. The government, on the other hand, can simultaneously tackle the problem of
derelict land and sustainable transport policies. In England 37 per cent of brownfield sites were converted
for sport and recreation uses between 1988 and 1993 and in the Netherlands between 10 and 15 per cent
become green spaces (de Sousa, 2004). As we noted above, these land use policies have a positive impact
on the demand for sustainable transport. Alternatively, brownfields may be used for residential and
commercial developments with new transport links. A successful example of this, which withstood
criticism, was the redevelopment of London’s 2,000 hectare Docklands area since 1981 (Florio and
Brownhill, 2000). It culminated in the 100 acre Canary Wharf business district, one of the most desirable
commercial locations in the world, connected by light rail, underground rail, bus and river to central
London, and where now about 80,000 people work (Metz, 2007, p.173).
Around three quarters of the Canary Wharf workforce commutes by public transport (Metz, 2008, p.47).
On one hand this is remarkable, because Canary Wharf is an area with probably the highest average salary
in the whole of the UK and most employees there can certainly afford cars (Metz, 2008, p.47). But on the
other hand, this is not surprising at all since the Canary Wharf complex has chosen to provide only 3,000
parking spaces (Metz, 2007, p.174).
3.2 Land use policies for new developments
Banister and Hickman (2006) argue that the structure of cities is an important factor in determining the
main characteristics of travel and thus influences ‘the numbers of trips made, journey lengths, modes of
travel used, and the resulting energy consumption and emissions’ (p.276). Socio-economic factors also
have an impact on travel, but the fact that the physical environment influences travel has a particular
relevance for policymakers as they can directly impact its development. Urban planners and developers,
by affecting the decisions made regarding new development, thus have a powerful tool in bringing about
changes in travel behaviour. One key issue in urban development is the problem of urban sprawl, which
tends to be defined using three concepts encompassing low density development with a lack of
coordination in urban growth and spatial segregation of land use (Gayda and Lautso, 2007, p.177). Urban
sprawl is associated with a number of problems, including those with regard to sustainable transport.
Urban sprawl induces high levels of private car use and increases trip lengths, with roads to the urban
centre often congested. Thus, urban sprawl leads to increases in fuel consumption together with CO 2
emissions and air pollution. Furthermore, urban sprawl is problematic in terms of accessibility and social
exclusion issues, as it tends to lead to people with limited mobility having poor access to important
services, which often require the use of a car (Gayda and Lautso, 2007, p.178).
3.2.1 The debate about polycentric vs. monocentric city design
Banister and Hickman (2006, p.277) note the polarisation in the debate about polycentric vs. monocentric
city design. Proponents of both scenarios tend to share the same aims: reducing the frequency and
distance of trips, traffic volumes and the associated energy consumption and emissions. The models
differ in that ‘the compact or polycentric city achieves this through higher densities and the dispersed city
through locating work near to where people live’ (Banister and Hickman, 2006, p.277). The key difference
between the options is that a compact city allows for the effective provision of public transport, as well as
walking and cycling, whereas the more diverse travel patterns in dispersed cities tend to lead to heavier car
dependency. At the heart of the debate is the idea that denser and more diverse (mixed use) development
reduces travel distances.
Reviewing the literature on the impact of monocentric and polycentric urban form on travel behaviour,
Schwanen et al. (2001) find it to be polarised, and empirical studies of this relationship are sometimes
contradictory, with ‘substantial difference between the theory and travel behaviour in the actual cities’
(Schwanen et al., 2001, p,176). They also observe the importance of spatial scale in analysing the effect of
polycentricity on travel behaviour. Studies of spatially large areas (such as commuting regions in Sweden
encompassing all settlements within 35 km from the regional centre) find that a polycentric structure
minimises the amount of energy required for transport (Naess, 1995 in Schwanen et al., 2001). However,
on a smaller spatial scale (Greater Oslo), descentralisation is found to have an adverse effect on energy
use in transport (Naess and Sandberg, 1996).
Finally, Banister and Hickman (2006, p.277) criticise that much of the available empirical analysis has
been quite simplistic, often failing to demonstrate causality in the relationships it tries to explain. This may
be due to the fact that linkages between land use and travel have many dimensions and can, in fact, not be
deconstructed very easily (Crane, 2000, p.18).
3.2.2 Dimensions of urban design and transport policy
The dimensions of urban design relevant for sustainable transport policy are more facetted than the
simple dichotomy between mono- and polycentric models. We will thus consider four key issues in the
physical environment: development size, density, diverse (mixed-use) development, and design. All four
aspects of urban development are, to some extent at least, under the control of urban planners, such that
conclusions for planning and transport policy can be drawn from the results. We now consider what kind
of policy measures can lead to sustainable transport and land use along the four dimensions above.
Banister and Hickman (2006, p.277) argue that ‘settlement size affects the range of jobs and services that
can be supported and influences the quality of public transport that can be provided, and the length of
trips’. In terms of transport the most energy efficient population size for settlement is thus found to be
between 25,000 and 100,000 or larger than 250,000.
Density is recognised as being a key issue in developing sustainable transport due to its effect on a
multitude of factors: Kenworthy and Laube (1996, p.281) thus note that ‘high densities tend to be
associated with lower average trip distances for all modes, improved public transport through higher
potential patronage around each stop and in particular, enhanced viability of walking and cycling’.
Furthermore, dense urban environments also tend to be characterised by mixed land use, with people
living, working and shopping in the close vicinity. Mixed-use developments thus allow further reductions
in trip lengths, and allow a prominent role for walking and cycling.
The design of neighbourhoods can also play a role in developing a model of sustainable mobility for
cities, by allowing a key role for walking and cycling through appropriate planning. An extreme example
of sustainable neighbourhood design policy is the design of entirely car-free neighbourhoods. For
instance, Sessa (2007, p.53) describes the Austrian car-free settlement in Vienna, Florisdorf, which was
designed as an ecological estate development. Inhabitants can only use the cars of the car sharing
company linked to the project and otherwise rely entirely on other modes of transport. The settlement is
well-linked to the city centre by tram and cycle routes, and within the neighbourhood services and
facilities such as shops and schools are within walking distance.
Combining all the elements of sustainable land use policy above can lead to a more sustainable model of
urban transport. Cervero and Kockelman (1997), for example, find that density, land-use diversity, and
pedestrian oriented designs have a modest to moderate impact on travel demand. They conclude that
their evidence is supportive of the notion that a combination of policies leading to more compact and
diverse development with pedestrian-friendly neighbourhoods can have a meaningful influence on
peoples’ travel behaviour.
However, Small and Verhoef (2007, p.14) note that the evidence on how land-use policies at the
neighbourhood level affect travel is rather mixed. High-density neighbourhoods with good access to
public transport stops clearly support higher use of public transport. However, it is less clear how much
of this is simply due to self-selection, i.e. people who want to use public transport choosing to live in less
car-dependent developments. It is important to control for this self-selection in order to determine the
aggregate effects of policies proposing to build many such developments (Small and Verhoef, 2007, p.14).
Van Wee (2009, p.290) thus concludes that ‘the accuracy of forecasts, for example of land-use scenarios
or infrastructure policies, could benefit from a better inclusion of self-selection in the models’.
There are, however, some basic land use features characterising a sustainable city (Banister, 2008, p.73): its
population should exceed 25,000 (preferably over 50,000), ‘with medium densities (over 40 persons per
hectare), with mixed use developments, and with preference given to developments in public transport
accessible corridors and near to highly public transport accessible interchanges’. Sustainable cities with
these features would be linked together to form agglomerations of hierarchical polycentric cities. Thus,
everyday facilities could be close by, while higher order activities could also be accessible through
connections to other cities.
3.3 Examples of cities with successful sustainable land use policies
3.3.1 Copenhagen
Monocle, a British monthly about international affairs, business, culture and design, judged Copenhagen to
offer the highest quality of life of any city in the world in 2008. This achievement is a culmination of
careful planning, transport policies and land use for sixty years.
In 1947 Copenhagen’s urban planners decided that in the future the then compact city should look like a
hand: the city centre would be a palm and smaller residential and mixed-use communities would extend
away from it like fingers. Simultaneously the urban planners were linking “fingers” to the “palm” with a
railway infrastructure, which now carries a modern train service, the S-tog. The average commuting
distance is 13.9 km, which is the largest amongst Western European capitals, but the average commuting
speed is also one of the highest (Schwanen, 2002).
After World War II the city was becoming easily accessible by public transport, but at the same time the
car was becoming more popular. Copenhagen was committed to discouraging car use and even now
reduces the number of parking spaces by three per cent every year (Newman and Kenworthy, 1996),
often replacing them with public spaces and parks (an example is Nyhavn). It is now the only European
capital which does not have a chronic problem of road traffic congestion (Vuk, 2005). Thus urban sprawl,
which appeared inevitable forty years ago, was contained.
Copenhagen has excellent walking and cycling facilities, with 349 km of cycle tracks and lanes
(Copenhagen City, 2006). Risk of serious casualty fell almost a fourfold between 1995 and 2006.
Copenhagen’s mode share of cycling and walking is one of the highest in Europe at 32 per cent
(Schwanen, 2002), cycling alone accounts for 26 per cent (Martens, 2004) and 36 per cent of people cycle
to work (Copenhagen City, 2006). But more interestingly the extensive cycling rack network at S-tog
stations means that a quarter of all S-tog passengers cycle to the station (Martens, 2004). There is a large
bicycle-sharing network, which operates on a deposit.
The vast S-tog system is supplemented by the Copenhagen Metro, a fully-automated rapid transit system.
Several S-tog stations have interchanges with the Metro and both networks use the same zone and
ticketing systems. There is a proposed expansion of the Metro in the city centre. Vuk (2005) estimates
that 70 per cent Metro passengers shifted from using the bus and between 8 per cent and 14 per cent
shifted from a private vehicle, making it effective at tackling congestion.
Finally, urban planners designated the space between the “fingers” to become green “wedges”,
recognising that green space is an important psychological factor in the inhabitants’ quality of life (Bolund
and Hunhammar, 1999). In the Netherlands, for example, 83 per cent of residents can easily reach a green
space by foot or bicycle (Capersen et al., 2006). They conclude that ‘land use has transformed from an
agricultural to a primarily recreational landscape’ in the “wedges” (Capersen et al., 2006, p.7), but they
insist that ‘future preservation and development of the green structure in Greater Copenhagen requires
regional planning measures to be incorporated into municipal plans’ (p.7). Copenhagen’s authorities are
already taking steps towards this and have integrated 39 km of cycling tracks into a “green cycling route”
(Copenhagen City, 2006) .
3.3.2 Hong Kong
Hong Kong is an example of a city whose remarkable success in achieving low car usage and a prominent
public transport system is closely linked to land use characteristics. Between 1981 and 1991 the increase in
car use per capita was only 146 km in Hong Kong (in contrast to 2,584 km in Los Angeles), while public
transport use increased by 104 trips per capita (Newman and Kenworthy, 1996, p.12). City-wide planning
has been central to this success. Public transit includes electric rail as well as buses and is complemented
by a dense mixed-use urban environment which allows for high levels of walking and cycling. Newman
and Kenworthy (1996) thus conclude that ‘central to the success of this model is high-density urban
development that is closely integrated around the transit system’ (p.13). Supporting this conclusion,
Zhang (2004) finds that in Hong Kong the role of land use has an independent impact on travel,
controlling for travel time and monetary costs. His evidence suggests that the composite effect of land
use on driving is of a comparable magnitude to the effect of driving cost on the same. He also notes that
while Hong Kong’s land use plays a key role, this is supplemented by strong fiscal policy measures to
restrain the demand for car use which make owning and running a car almost prohibitively expensive.
These policies together complement each other as an effective combination in limiting the growth of car
use in Hong Kong (Zhang, 2004). Finally, it is also possible to draw some policy recommendations for
developing countries from the example of Hong Kong. Newman and Kenworthy (1996) note that ‘The
high-density and in many cases pre-existing linear form of development in many Third World cities is
more than adequate to enable good transit systems to be built’ (p.13), implying that congestion and
environmental problems faced in cities such as Bangkok, Manila, and Jakarta could be addressed by
implementing public transport based on the model of cities such as Hong Kong or Singapore.
3.3.3 Freiburg
Freiburg, a town with about 220,000 inhabitants in 2008 (Amt für Bürgerservice und
Informationsverarbeitung Freiburg, 2008), is the economic, political and cultural centre of the Black
Forest region in the south-west of Germany. Pucher (1998) presents the case of Freiburg as a success
story of land use and transport policies complementing each other to provide models for urban transport
without car-dependence. He notes that probably the most important land-use policy was undertaken in
the aftermath of World War II, which almost completely destroyed the town’s central area. The decision
to resurrect much of the town’s old urban structure, with its narrow, winding streets and monumental
squares ensured that walking and cycling would be at the heart of transport in the town centre. This
decision, reinforced by many other land-use policies, can be considered a reason ‘for the success of public
transport, bicycling and walking in the succeeding decades’ (Pucher, 1998, p.294).
Pucher (1998) reports the modal split trends for Freiburg documenting its success story: the total share of
the car in passengers’ total number of trips decreased between 1976 and 1994 from 39 to 36 per cent.
Over the same period the shares of public transport and the bicycle increased from 14 to 21 and from 12
to 22 per cent respectively, reflecting a number of policies including a large increase in cycle lanes (Amt
für Bürgerservice und Informationsverarbeitung Freiburg, 2007a), expansion of the light rail network and
bus services, as well as measures such as integrated ticketing between different transport modes. Between
1974 and 2007 the number of passenger trips on public transport thus rose from 34,078,000 to
71,995,000 with a dramatic rise in the proportion of passengers using a regional travel card (37.8 per cent
(12,874,000) in 1974 and 85.6 per cent (61,615,000) in 2007 (Amt für Bürgerservice und
Informationsverarbeitung Freiburg, 2007b), indicating that public transport use has become established
amongst the inhabitants of Freiburg. These measures have been complemented by the strict land-use
policies in Germany, where development at the urban fringe is sharply restricted by state and local
governments (Pucher, 1998). Limiting the supply of land available for development increases the price of
land, encouraging density of development. Even in suburbs, development is thus compact, facilitating
public transport with its reliance on focused travel corridors with high densities and volumes (Pucher,
1998). The combination of land use and transport policies has thus been at the core of sustainable
transport development in Freiburg.
3.4 Concluding remarks
As we outlined in this section, the focus of land use policies should be on reducing travel demand by
decreasing the physical separation of facilities and destinations. Medieval cities, especially in Europe, were
built to be suitable for walking. They achieved this by using high-density and mixed-use developments
(Greene and Wegener, 1997, p.182). However, simultaneous rapid urbanisation and advances in rail and
road transport have led to sprawling cities with low population density and poor accessibility. This in turn
has stimulated greater demand for transport. Containing that vicious circle through policies outlined in
this section will be a high priority for urban planners who want to achieve transport sustainability in the
near future.
4. Incentives to walking and cycling
Walking and cycling improve general health, save money for those who adopt them instead of any other
transport mode, produce no local pollution or CO 2 emissions and can be, ironically, quicker than
motorised forms of transport in congested conditions. Walking and cycling will become an integral part
of a modern transport environment (Banister, 2008). While walking and cycling are not suitable for long
distances, they can be an excellent option for short distance trips. Reducing travel distance for commuters
and casual users through appropriate land use would serve as a primary incentive for walking and cycling.
Integration of public transport with walking and cycling facilities creates sustainable travel possibilities
which are inconceivable without it. In this section we focus on why people would choose walking and
cycling as an option for short distance trips within towns and cities. We summarise the evidence regarding
health benefits stemming from them, the potential benefits for the environment, some safety issues and
concerns, and we finish by highlighting some examples of good practice.
4.1 Walking and cycling as options for short distance trips
Walking and cycling can be done for a variety of reasons: for recreation - leisure or exercise, or for
transport - to go shopping, or to work, and to visit friends and family or conduct other social activities.
There is considerable variation in purpose of travel amongst countries: in the US 70 per cent of cycling
trips are recreational, whereas in Holland and Germany between 60 and 65 per cent of cycling trips are to
work or school, or for going shopping (Plaut, 2005, p.348). Often, however, it is a mixture of both, which
means that there is a broad range of factors which affect incentives to walking and cycling (Owen et al.,
2004; Saelens et al., 2003).
Commuters are encouraged to walk and cycle if the trips which they want to make are shorter. Sprawling
and low-density neighbourhoods discourage people from walking and cycling and make them more
dependent and more used to cars (Pucher et al., 1999). For example, according to the 2001 US National
Household Travel Survey adults walked only 21.2 per cent of trips of 1 mile or less. Richer households
tend to walk fewer short distance trips (Ham et al., 2005; UK DfT, 2007b), which suggests that rising
incomes in developing countries will probably further discourage people from walking and cycling in the
future (Hook and Replogle, 1996).
At the moment there are no comparable international surveys which study the impact of various policies
on walking and cycling (Bassett et al., 2008). However, local walking and cycling policies have been
subject to empirical scrutiny around the world.
Cycling, in particular, has received substantial attention and some patterns and debate have emerged in
the extensive literature. First, a common barrier to increasing cycling use has been the perceived risk of
cycling. Safety appears to be more valued than time saved by cyclists (Hopkinson and Wardman, 1996).
Noland and Kuhnreuther (1995) report a survey conducted in the City of Philadelphia where 35 per cent
of respondents said that the provision of a cycling lane would be a necessary condition to start cycling to
work; thus the authors conclude ‘safety concerns are a major disincentive to increased bicycle commuting’
(Noland and Kuhnreuther, 1995, p. 68). Noland (1995) presents another survey which reflects that cycling
is perceived to be the most dangerous form of transport, but he estimates that the perceived risk elasticity
of cycling is less than -1. This means that reducing perceived risk would disproportionately increase
cycling. This raises an important second issue. Conventionally safe walking and cycling facilities may give
users an incentive to use them recklessly, because they would overestimate the reduction of risk. Hence
cycling facilities must be designed very carefully: this concerns the width of the cycling lane, the buffer
between the road and lane and whether the lane should be on or off the road. Rivara et al. (1998) report a
study in Davis, California, which finds that, although cycling paths are associated with a lower incidence
of most types of collisions, there is an 80 per cent increase in the risk of collision for cyclists turning left
into traffic. Another example is that cyclists experience significant discomfort when a cycling lane is
interrupted near a prominent intersection or near a parking lane (Krizek and Roland, 2005). These sorts
of observations reflect the imperfections of individual policy measures and underline the importance of
integration of all policies and modes.
An important example of this is the physical integration of railway stations and walking and cycling
facilities. Developing access and egress facilities, such as bicycle parking, bicycle hire points, access ramps
and cycling lanes leading directly to railway stations, can increase the appeal of a no-car journey. Leaders
in sustainable transport tend to excel in this dimension: the Netherlands had 104 large bicycle stations at
major railway stations compared to Italy’s two (Janic and Reggiani, 2001). Givoni and Rietveld (2007) find
that in the Netherlands the quality of such facilities has a positive effect on the perceptions of rail travel,
thereby reinforcing the appeal of public transport. There are, of course, many obstacles to seamless multimodal sustainable transport. Rietveld (2000) observes an asymmetry in the modal share of journeys to the
railway stations at the home and the activity ends in the Netherlands (walking is the most popular mode
of access to railway stations at the activity end and bicycle at the home end). The importance of walking
at the activity end should indicate to the land use planner that locating offices and shops near railway
stations is highly desirable.
Moudon et al., (2005) show that physical and environmental infrastructure in urban areas of the US is
only moderately associated with cycling, because of its poor provision. The authors are optimistic and
argue that ‘policy and intervention programs could increase cycling by improving both actual and
perceived environmental conditions’ (Moudon et al., 2005, p.246).
Here we summarise some of the features that were part of successful policies in various cities and
countries. However, as mentioned above, it is not possible to exaggerate the importance of integration of
these policies. We then proceed to quantify the effects of individual measures with respect to health,
environment and the broader economy.
4.1.1 Walking
Policies, which appear to encourage walking for shorter trips for recreational and transport purposes,
include:
Reducing crime in neighbourhoods (see Pedestrians’ and Cyclists’ Safety below). People often feel
vulnerable when walking late in the evening or in a deserted neighbourhood. The car would offer
the feeling of protection; however, if people even perceive that crime is low, they will be more
inclined to walk short distances. Regular police patrols could make roads feel a safe place for
walking.
Wider, better-maintained and cleaner pavements. Regular cleaning of pavements contributes to a
pleasant walking environment.
Improved street furniture, including flower-beds, trees, kiosks, benches. Any such infrastructure
can create a sense of safety and will encourage walking.
Safe crossings with shorter waiting times. This is particularly important around schools and
offices during peak hours. If pedestrians can cross wide roads quickly and safely, this will reduce
walking time and distance.
Weather protection. This may be quite relevant in colder or more humid climates.
Sources: Moudon and Lee (2003), ADONIS (1999), UK DETR (2000).
4.1.2 Cycling
Policies which appear to encourage cycling for shorter trips for recreational and transport purposes,
include:
Improving and building bicycle lanes and paths; giving cyclists priority at junctions. Despite the
issues discussed above, most authors believe that cycling lanes make cycling safer. Wider, colourcoordinated and clearly-marked exclusive cycling lanes mean that traffic will be able to pay closer
attention to them. Junctions pose problems because cyclists often fail to indicate their movement
intentions. Separate traffic lights, opposite-direction lanes in one-way streets and priority at
junctions could make cycling safer and more appealing.
Providing convenient and safe bicycle parking at popular locations, including shopping areas,
train stations, offices, etc. We discuss the importance of good land use and integration in other
sections of this volume, but we stress again that commuters put value on the ability to seamlessly
interchange between several modes of transport.
Showers in offices. Cycling as part of a vigorous exercise routine can induce tiredness and
sweating. Some employers provide showers and locker facilities for employees who prefer to
cycle in the appropriate gear and change into a suit once they get to work.
Increased funding for cycling programs, including safety training programs for schoolchildren,
bicycle repair workshops, bike weeks, etc. Cycling awareness is an important part of any national
cycling programme. We discuss advertising and other behavioural incentives in Section 10.
Sources: Nelson and Allen (1997), Dill and Carr (2003), Pucher and Buehler (2006), Pucher et al.
(1999), Hunt and Abraham (2007), UK DfT (2008a), Krizek et al. (2009).
4.1.3 Walking and cycling
Policies, which appear to encourage both walking and cycling for shorter trips for recreational and
transport purposes, include:
Less car parking. This has the double benefit of making car driving less possible (and therefore
walking and cycling more attractive) and of making the environment less congested, safer and
more pleasant.
Lower speed limits. These have both perceived and actual effects on cyclist and pedestrian safety
and can be implemented particularly effectively in urban areas. In fact, introducing cycling lanes
on roads with a high speed limit may put cyclists in too much danger.
Accessible public transport. This relates directly to the issue of integration again: some cyclists
may want to take the bus or the train on the intermediate leg of their journey, therefore cycle
ramps on buses and trains would make the interchanges easier.
Grid layouts. These clearly help distinguish the road space that belongs to each type of road user.
Sources: as above and Woodcock et al. (2007).
4.2 Health benefits
There is plenty of medical evidence suggesting that walking and cycling improve physical and mental
health. In 1896 William O’Neil wrote a letter to the editors of Lancet claiming to ‘have found the
moderate use of the bicycle to produce the most admirable effects on young people’ (O’Neil, 1896,
p.1591) The current WHO recommendation is based on Haskell et al. (2007, p.1081): ‘all healthy adults
aged 18 to 65 yr need moderate-intensity aerobic (endurance) physical activity for a minimum of 30 min
on five days each week or vigorous-intensity aerobic physical activity for a minimum of 20 min on three
days each week.’ Walking and cycling can be a part of regular physical exercise. Active commuting via
walking and cycling significantly reduces rates of coronary heart disease (Hu et al., 2007), type-2 diabetes
(Hu et al., 2003), cancer and stroke (Cavill et al., 2007) and all-cause mortality rates (Andersen et al., 2000)
in both men and women.
Walking and cycling and other types of regular physical exercise reduce obesity, which is linked directly to
the aforementioned morbidities (Ogilvie et al., 2004; Matthews et al., 2007; Bauman and Rissel, 2009, for
a review). Obesity is a growing public health concern in Europe (James et al., 2004), the US (Ogden et al.,
2006) and many developing countries (Prentice, 2005). The UK government, for example, is integrating
the promotion of cycling with its obesity reduction strategy (UK DfT, 2008a).
It is not surprising that developed countries, where walking and cycling are more prevalent either as a
form of recreation or transport, tend to have lower obesity rates (Bassett et al., 2008). On a national scale
obesity tends to rise with income (Vandegrift and Yoked, 2004); however, within countries, obesity is
more common amongst people with lower incomes and those living in sprawling neighbourhoods
(Drewnowski and Darmon, 2005; Vandegrift and Yoked, 2004). Walking and cycling programs should
therefore be aimed specifically at those high-risk groups.
4.3 Benefits to the environment
Walking and cycling are forms of transport which produce no carbon emissions or pollution.
Encouraging people to switch from polluting forms of transport, such as cars, to walking and cycling will
reduce carbon emissions. In the UK, for example, 21 per cent of CO 2 emissions come from journeys of
less than 5 miles which can be made by foot or bicycle (UK DfT, 2009b). Walking and cycling are also
particularly beneficial because they tend to substitute for short distance car trips, which have the highest
emission rates (André and Hammarström, 2000).
The environmental benefit of walking and cycling will depend crucially on how many car trips can be
substituted by walking and cycling. Sustrans (2008) suggests that in the UK at least 47 per cent of urban
car trips could be walked or cycled, even under current conditions. Gross et al. (2009, p.27) calculate that
bringing walking and cycling levels in the UK to the level of Germany or the Netherlands will reduce total
carbon emissions from transport by 6 per cent per annum. In the US, the figure is probably lower,
because of lower population density, but at least 24 per cent of car trips are less than a mile (Ham et al.,
2005) and half of all trips are less than three miles (Pucher and Dijkstra, 2000) and therefore there is
substantial potential for increased walking and cycling. Komanoff and Roelofs (1993) estimate that 1 per
cent of car travel replaced directly by cycling or walking would reduce transport carbon emissions by 2-4
per cent in the US. However, it is difficult to estimate which modes of transport will be substituted by
walking and cycling. In countries with a developed sustainable transport infrastructure cycling often
substitutes public transport travel. This means that promoting public transport can have negative effects
on the environment as some trips which can be cycled will be replaced by the carbon-emitting transport.
After the Netherlands introduced a free public transport pass for students in 1991 the modal share of
public transport in student travel increased dramatically and 80 per cent of the increase was at the expense
of the bicycle (Preston, 2008, p. 199).
The International Energy Agency (IEA, 2001) adopts a different approach and estimates that in a country
where walking and cycling accounts for 10 per cent of total per-kilometre travel (EU average is 5 per
cent), a 25 per cent actual increase in nationwide walking and cycling would reduce carbon emissions
from private cars by approximately 2 per cent. Gross et al. (2009) give a summary of how effective
walking and cycling adoption is at reducing carbon emissions, but point out that there has been very little
focus in the literature on exact and systematic measurement.
4.4 Pedestrians’ and cyclists’ safety
4.4.1 Safety in numbers
Road safety must be an important concern in walking and cycling policy. About 44 per cent of trips were
made by bicycle or on foot in the Netherlands and Germany, compared to 7 per cent in the US in 1995,
but in 2001 the road fatality rates in the Netherlands and Germany for pedestrians and cyclists were
between three and six times lower than in the US (Pucher and Dijkstra, 2000; Pucher and Dijkstra, 2003).
In 2006 in the UK there were 31 cyclist and 36 pedestrian fatalities per billion passenger km travelled (UK
DfT, 2008b, Table 1.7) and the respective numbers for the US in 2001 were 72 and 140. Like in the UK,
it is more dangerous to walk or cycle in the US than to travel by car. Jacobsen (2003) carries out an
extensive study across several European countries and cities in the UK, Denmark and California and
concludes: ‘the likelihood that a given person walking or bicycling will be struck by a motorist varies
inversely with the amount of walking or bicycling. This pattern is consistent across communities of
varying size, from specific intersections to cities and countries, and across time periods’ (p.205). He finds,
for example, that doubling the number of people walking reduces the individual risk of fatality by 66 per
cent, a relationship that is fairly robust across his datasets. Sonkin et al. (2006) in their analysis of children
road fatalities warn of a ‘vicious circle of rising road danger leading to more children being driven which
increases traffic volumes adding further to road danger’ (p.405)
Robinson (2005) and various authors reviewed in Turner et al. (2006) find that a similar pattern of ‘safety
in numbers’ applies in many countries and cities.
The results, however, do not imply that simply forcing more cyclists and pedestrians on the road will
make them safer. What works is investing into walking and cycling infrastructure and educating car
drivers about vulnerable road users. When people perceive that the risks from walking and cycling are
lower, they will be more willing to use the new facilities (Nelson and Allen, 1997).
4.4.2 Helmet use and cycling
Using cycling helmets reduces the risk of head injuries (Cameron et al., 1993; Rivara et al., 1994), which
has led several researchers to advocate compulsory helmet use, particularly among children (Thomas et
al., 1994). Rivara et al. (1997) argue that this is not enough and a combination of policies, including cycle
lanes, speed limits and education is necessary to prevent cycling injuries.
However, if helmet use discourages cycling, then individual risk for cyclists could increase (according to
the safety in number phenomenon described above) and compulsory helmet use could cause an increase
in the road fatality rate. Robinson (2006) points out that the current evidence in favour of compulsory
bicycle helmets is at best ambiguous.
4.5 Economic benefits of walking and cycling
If investment in walking and cycling programs causes improvements in health and the environment, the
society will reap economic benefits of:
Improved health - due to reduced healthcare costs and mortality and increased productivity. In
the US, for example, $117 billion (£80bn, €88bn) are spent annually on healthcare for the obese
and overweight (Higgins, 2005). The World Health Organisation has developed a “Health
Economic Assessment Tool for Cycling”, which allows a cost-benefit assessment of a cycling
infrastructure project. Krizek (2007) reviews several studies, which estimate indirect and direct
annual savings of physical activity at between $19 (£13, €14) and $1,175 (£800, €890) per capita.
However, as Cavill et al. (2008, p.292) point out: ‘important questions remain to be addressed
regarding the type and extent of health benefits which can be attained through investments in
policies and initiatives which promote more cycling and walking.’
Reduced road fatalities - road traffic injuries are a major cause of disability and death around the
world and the problem is particularly acute in developing countries (Nantulya and Reich, 2002).
As we described above, due to ‘safety in numbers’ a shift from cars to walking and cycling will
reduce accident rates and costs.
Small businesses - Whitehead et al. (2006), for example, cite various papers which find positive
economic effects of pedestrianisation, including an average increase in retail business turnover of
17 per cent across 22 cases.
Reduced cost of road maintenance, vehicle maintenance and parking.
Reduced pollution and carbon emissions
Litman (2004, 2007) offers a rough economic evaluation of shifting from motorised transport to walking
and cycling. Economic impact of particular walking and cycling projects varies depending on their
location, suitability and size. The UK DfT (2008a) estimates the average benefit-cost ratio of cycling at
3.2, although Krizek (2007) reports ratios as high as 20 for a project in Delhi and as low as 1.5 for a
project in Amsterdam. There are clearly decreasing returns to investment. The Amsterdam project was a
city-wide improvement in the core bicycle network and a provision of high-quality bicycle parking,
whereas in Delhi the local authorities built a simple 9 km corridor to a road with bus and cycling lanes.
4.6 Examples of successful implementation
There is substantial variation in walking and cycling patterns in developed and developing countries. The
most common currency for measurement is the percentage of all trips made by bicycle. In some
developed countries, such as the US, the UK and Australia, the percentage stands at or below 1 per cent,
even in urban areas (New York - 0.5 per cent). Some European countries do a lot better: Germany,
Sweden and Finland (10-11 per cent) are almost double the European average, although they pale in
comparison to Denmark (18 per cent) and the Netherlands (27 per cent) (Pucher and Buehler, 2008).
Data for developing countries is a little sparser. In China in the early 1990s, some cities enjoyed
remarkable bicycle use: Beijing (54 per cent) and Tianjin (75 per cent), however, as incomes rise we expect
the downward trend to continue (Barter, 2000). In Delhi, for example, cycling rates (including twowheelers and rickshaws) fell from 59 per cent in 1969 to 38 per cent in the 1980s and all the way to 6.6
per cent in 1994 (Singh, 2005). Other cities, such as Sao Paolo, Manila, Hong Kong and Bangkok had
negligible cycling rates in the 1990s (Barter, 2000).
Finally, we turn to a discussion of several examples of successfully implemented cycling policies.
4.6.1 The Netherlands
The Netherlands carried out the first and probably the most successful official bicycle policy in the world
(Rietveld and Daniel, 2004). A typical Dutchman cycles 2.5 km daily, which is 25 times more than does an
average Spaniard, Greek or American. Almost a quarter of longer-distance trips (4.5 km-6.4 km) are made
by bicycle, compared to 1 per cent in the UK.
The high cycling rates in the Netherlands are, obviously, not a result of unaffordable motorised transport
(GDP per capita was over $52,000 (£35,600; €39,500) in 2008 according to the IMF). The Netherlands is
fortunate in terms of its moderate climate (although strong winds discourage cycling), high population
density and compact settlements (Rietveld and Daniel, 2004); however, its success came from the
government policy adopted in 1975. This policy favoured the use of bicycles and introduced a fund for
the construction of bicycle facilities in both urban and rural areas. Roughly €227 million (at 2004 prices)
were spent over ten years (Rietveld and Daniel, 2004, p.536). The policy managed to reverse the fall in
cycling rates and curtail a rapid expansion in car ownership (Pucher and Buehler, 2008).
There is no single prescription for the Netherlands’ success. Local municipalities and cities adopted policy
packages aimed at encouraging cycling. Rietveld and Daniel (2004) claim that the most influential policy
interventions were: reducing journey times by bicycle compared to car, reducing the number of stops, and
increasing car parking costs and safety. All of these can be achieved by a combination of policies, such as
separate cycle lanes and traffic calming measures.
4.6.2 Denmark and Germany
Pucher and Buehler (2008) find that the success of Danish, Dutch and German cycling programs was due
to similar policy packages. Although overall Germany and Denmark have lower cycling rates, some cities,
such as Copenhagen and Münster match the Dutch average. Germany, for example, tripled its cycle path
network between 1976 and 1995. Like the Netherlands, many German cities invested in improving
cycling safety, by separating car traffic from cyclists and integrating the cycling network to make cycling a
practical mode of transport (Pucher and Dijkstra, 2000). In fact, Germany, like the Netherlands, has
brought down fatality rate for cyclists by 60 per cent since 1975. The German rate (25 per billion km
travelled) almost matches the Dutch rate (17) and is a long way from the US (100), which has only
reduced its fatality rate by 20 per cent between 1975 and 1995 (Pucher and Dijkstra, 2000).
4.6.3 Bogotá
When a country is ravaged by guerrilla warfare and drug smuggling, sustainable transport is usually cast
aside. However, urban planners in the Colombian capital have not lagged behind their Dutch
counterparts (who are their advisors) in attempting to transform Bogotá’s transport in a modern and
sustainable way. They introduced the following measures: building 300 km of cycle lanes (the most
extensive in Latin America), connecting the lanes and pedestrian pathways to the new bus rapid transit
system, building a 17 km (world’s longest) pedestrian corridor, planting trees along cycling and walking
lanes, restricting driving along 120 km of roads on Sundays to create a ‘Cycle Way’ . The total investment
of $178 million on bicycle improvements has increased the share of daily trips by bicycle from 0.9 per
cent to 4 per cent over the past decade (Cervero, 2004). The entire policy package in Bogotá reduced the
capital’s carbon monoxide levels by 28 per cent between 1998 and 2002 (Nair and Kumar, 2005) and
reduced travel times by 11 per cent (Skinner, 2004). Interestingly, this new transport model was driven by
the need to reduce poverty and promote social justice as opposed to environmental concerns (Cervero,
2004; Skinner, 2004).
4.6.4 OYBike in London, Velib in Paris and Bicing in Barcelona
In August 2004 the Borough of Hammersmith and Fulham in London piloted a bicycle rental scheme,
called OYBike. Similar small-scale schemes had already existed in Stockholm, Lyon, Frankfurt, Cologne
and Munich. Bicycles were located at unmanned locking stations around the borough. After completing a
registration process residents could hire bicycles on a per-hour or per-day basis. The scheme was not a
particular success. Research conducted by Noland and Ishaque (2006) suggests that most trips with
OYBike were made for leisure and recreation on sunnier days and weekends. Users tended to substitute
short walking trips by cycling, so the environmental impact of the program is probably quite small. The
reason for the apparent lack of success is probably the lack of appropriate cycling infrastructure in
London and frustrating payment facilities. Boris Johnson, the mayor of London, is continuing the
investment programme commenced by his predecessor, Ken Livingstone. In 2009 £111m will be spent
on improving cycle lanes and parking in extensive Cycle Hire and Cycle Highways schemes. These will
provide continuous cycling corridors criss-crossing central London and safety training14.
In 2007 Paris and Barcelona rolled out two bicycle sharing programs, which were much larger in scope
and ambition. The programs introduced bicycle locking stations around the entire city: Velib operating
over 20,600 bicycles in Paris and Bicing operating 3,000 in Barcelona. Paris achieved an extraordinary
penetration of 135 citizens per bicycle (Shaheen and Rodier, 2008). The schemes are run by private
companies, which introduced annual subscriptions, smart-card payment and reservation technologies.
Economies of scale allowed prices to be drastically reduced to €1 (£0.90, $1.3) per day in Paris, which
compares to £8 (€9, $12) per day charged by OYBike in London. Velib, by all accounts, has become the
face of sustainable Parisian transport. Full evaluations of the schemes are yet to be done, but there are
signs that commuters in Paris and Barcelona are substituting from cars into Velib and Bicing to travel to
work and complement their use of public transport (Shaheen and Rodier, 2008).
4.7 Concluding remarks
As we illustrated above in the example of Bogotá, increasing walking and cycling can rightly be perceived
as drivers of social inclusion (UK Social Exclusion Unit, 2003). In the UK, nearly one in three households
does not have access to a car. And yet access to important destinations, such as out-of-town shopping,
hospitals and remote office locations, is becoming more dependent on car use. Vicious circles can arise
whereby disadvantaged households cannot gain access to employment or healthcare and become poorer
and more vulnerable. Making more destinations accessible on foot or by bicycle will erase the inequality
of accessibility and alleviate poverty. Cycling is extremely affordable, even to the poorest members of
society; however, public awareness campaigns are necessary to destroy the image of the bicycle as the
transport mode of the poor. Quality of facilities also plays an important role, since its makes participation
in sustainable transport more personal and pleasant. In developing countries, which we discuss in Section
7, bicycles can be an effective transport solution for teachers trying to reach schools in remote locations
(Njenga and Davis, 2003).
14 http://www.tfl.gov.uk/corporate/media/newscentre/archive/11802.aspx
Some aspects of walking and cycling, such as compulsory helmet use and cycling lane design, still require
thorough empirical research. Although there does not need to be a trade-off between walking and cycling
policies, it is not desirable to treat them, as some authors do, as a single “non-motorised” mode. We find
that most literature has highlighted unambiguously positive, and often non-marginal, effects on health,
environment and the economy. From a social cost-benefit perspective, investments in walking and cycling
can be excellent and policy-makers rightly choose to make them a cornerstone of nationwide sustainable
transport programmes.
5. Road construction
Building new roads and expanding existing ones used to be seen as one of the most promising ways to
reduce traffic congestion. In the late 1980s - early 1990s many countries followed this line of thought.
The idea seemed reasonable at first sight. Transport growth could be predicted on the basis of forecast
population, income and car ownership trends, and whatever other variables the government deemed
suitable, and roads were built to satisfy demand for travel (Noland, 2007, p.3). This was known as the
‘predict and provide’ approach.
In the UK, for example, plans to substantially extend the network, according to traffic growth forecasts,
were laid out in the Roads to Prosperity White Paper (UK Department of Transport, 1989), which proposed
an unprecedented expansion of the road network in the UK, with around 500 road schemes, to meet the
forecast demand.
Three sources of opposition emerged after the document was published: opposition based on
environmental concerns, opposition based in financial concerns and opposition based on a lack of
understanding of how consumers would react if the facilities were not provided. The environmental
opposition focused on the effects on the countryside and quality of life, and to a lesser extent, on climate
change15 (UK DfT, 2007c, p.19). The second criticism centred on the high financial costs of the plans and
whether they would meet the forecast demand (Noland, 2007, p.3). Finally, a third criticism was that the
forecasts made seemed to ignore any potential reactions from consumers in a scenario where the road
network was not expanded (Noland, 2007, p.3).
Following these concerns, the Standing Advisory Committee for Trunk Road Assessment (SACTRA)16 in
the UK reassessed the issue and produced a report with some surprising and unexpected conclusions, the
main one being that building and expanding roads increased, rather than decreased, congestion, and
ultimately induced higher levels of travel demand. It concluded that ‘induced traffic can and does occur
probably quite extensively, though its size and significance are likely to vary widely in different
circumstances’ (SACTRA, 1994, para.15.03).
15 In the early 1990’s there was already scientific evidence on the impacts of anthropogenic CO 2 emissions on global warming, but the concept
was not as widespread as it is nowadays.
16 SACTRA is an independent committee in the UK appointed by the Secretary of State for Transport to advise on issues related to the appraisal
of trunk roads. The Committee was given specific terms of reference to work on a number of issues, met several times and produced a number
of reports, which were published between 1994 and 1999. The last report was published in 1999, the Committee is not meeting at present and as
of 2009 there are no current plans to provide a new remit.
5.1 Induced traffic
Coombe (1996, p.2) notes that SACTRA’s first task was to define ‘generated traffic’, not an easy task, and
in fact the term ‘induced traffic’ was found to capture the phenomenon more rigorously. Hills (1996, p.6)
recounts that the SACTRA committee thus decided to rephrase their research question, asking whether
new or improved roads induce, rather than generate traffic. The idea is that poor quality of service (such as
congestion) on the road network suppresses traffic. On the converse, improving the road network and
reducing congestion then induces extra traffic (Hills, 1996, p.6).
Induced traffic is traffic that is present because an expansion in road capacity has occurred. If there had
been no expansion this extra traffic would not be there (Goodwin and Noland, 2003, p.1451). Crucially
this implies that due to the increase in traffic volume associated with road construction, congestion relief
from this measure will be less than anticipated, or shorter in duration: building roads does not relieve
congestion. This increase in traffic flow associated with road construction comprises many different
effects: people may choose to shift to a different mode of transport, or make more frequent trips between
the same origins and destinations (Hills, 1996, p.6). People may take longer routes, and the road may
affect their decisions where to work or shop, which could lead them to travelling greater distances.
Indirect changes can also occur, ‘due to making undeveloped land more accessible, changes in
employment, and the consequential land-use changes resulting from all these choices’ (Goodwin and
Noland, 2003, p.1452). The mechanism behind all these different effects is not the fact that extra capacity
itself induces traffic, but rather that the extra capacity reduces the general cost of travelling (i.e. time and
money costs of travel). Essentially, the induced traffic theory thus states that there is a demand curve for
travel: ‘the cheaper the travel, the more will be demanded’ (Goodwin and Noland, 2003, p.1452).
5.1.1 Evidence
Empirical studies estimating the impact of expanding road capacity on the road system can broadly be
divided into those studying particular facilities, area-wide studies, and studies of travel time elasticities
(Cohen, 1995). Cohen notes that early studies of specific facilities date as far back as 1947, with
Jorgensen’s analysis17 of the construction of the Merritt and Wilbur Cross parkways, which he found to
have generated 20 to 25 per cent more traffic in excess of its normal expected growth rate (Cohen, 1995,
pp.295-296). Goodwin (1996), largely summarising results presented in SACTRA (1994), concludes that
while induced traffic depends heavily on the specific scheme’s context, on average studies find an
elasticity of traffic volume with respect to travel time of around -0.5 in the short term, and as large as -1.0
in the long term (Goodwin, 1996, p.53).18 The estimates above thus mean that a 10 per cent decrease in
journey time associated with a road improvement will lead to a 5 per cent increase in traffic volume in the
17 Jorgensen, R.E., (1947), ‘Influence of expressways in diverting traffic from alternate routes and generating new traffic’, Proc eedings of 27th
Annual Highway Research Board Meeting.
18 Elasticities are a common measure used in economics. The elasticity of one variable with respect to another is defined as the percentage
change in one variable resulting from a percentage change in the other variable. For example if the price of a good or servic e increases by 40 per
cent and, as a result, the quantity demanded decreases by 10 per cent, the price elasticity of that good or service is 0.25.
short-run, rising up to 10 per cent in the long-run. Another way to find evidence for induced traffic is to
observe differences in forecast and actual traffic flow following road improvements. Thus, for 151
Department for Transport schemes, traffic forecasts underestimated actual traffic flows a year after
opening by 10.4 per cent on average (Goodwin, 1996, p.53). More recently, however, studies have
employed a more direct measure to determine the relationship between road construction and total
vehicle travel, estimating elasticities of vehicle miles of travel with respect to increases in lane miles
(Goodwin and Noland, 2003, p.1453). Hansen and Huang (1997), for instance, using data for both
metropolitan areas and urban counties in California, estimate an elasticity of 0.6-0.7 at the county level
and 0.9 at the metropolitan level, implying that induced traffic must be taken into account in order to
assess road capacity enhancements correctly.
Prakash et al. (2001), on the other hand, seemingly go against the mounting evidence on the importance
of induced traffic, as they find that their results do not support the hypothesis that aggregate expenditure
on road improvements and road construction “induces” additional traffic (p.1584). Goodwin and Noland
(2003, p.1456), however, note that these results in no way undermine the induced traffic theory, as the
study by Prakash et al. (2001), they claim, uses road expenditure data as its policy variable, which is the
wrong variable for modelling induced traffic effects. Their results do not contradict the induced traffic
theory, but merely emphasise that the link between road budgets and road building is not particularly
strong (Goodwin and Noland, 2003, p.1456).
Single equation models such as that used in Hansen and Huang (1997) can, however, potentially be
criticised for failing to capture the true cause and effect correctly, due to simultaneity bias. The
simultaneous equation model employed by Cervero and Hansen (2002) addresses this problem,
accounting for the fact that correlation between road supply and traffic does not only comprise the fact
that road supply induces traffic, but also the fact that planners may anticipate demand for traffic and build
roads in response. The first effect is the familiar induced-demand, whereas the second one is termed
“induced-investment”. Cervero and Hansen (2002) find evidence for both effects at county-level data in a
study for California: controlling for other factors as well as simultaneity they find a 10 per cent increase in
lane-mile capacity to be associated with a 5.9 per cent increase in vehicle miles travelled. The inducedinvestment effect was smaller, with a 10 per cent increase in vehicle miles travelled associated with a 3.3
per cent increase in lane-mile additions (Cervero and Hansen (2002, pp.478-479). Goodwin and Noland
(2003) cite a consensus estimate of between 0.3-0.5 (perhaps higher in the long-run) for the elasticity of
vehicle miles travelled with respect to increases in lane miles. They thus conclude that ‘results establish a
causal link between expansions of capacity, measured as lane miles, and growth in vehicle miles of travel’
(Goodwin and Noland, 2003, p.1453).
5.2 Investment in roads vs. investment in railways
Given the evidence above that building roads can generally be considered ineffective in solving the
problem of congestion, a direct analysis of the costs and benefits of investing in roads and railways is a
logical step to take next. 19 Affuso et al. (2003) provide a general framework for assessing whether public
19 It may be noted here that induced travel demand applies to all modes of transport, including rail.
expenditure, at the margin, is better spent on improving trunk roads or interurban rail. They find that the
costs associated with many projects improving transport are outweighed by the benefits, but that the
returns to road schemes tend to be larger than those for railway. Several qualifications to this result must
be noted, however. In particular, their result depends on the values used in calculating the environmental
cost of transport projects. Evaluating environmental costs is controversial, and estimates differ between
studies (Affuso et al., 2003, p.285). With more weight placed on environmental costs, investments in rail,
which result in somewhat greater environmental savings, become relatively more attractive (Affuso et al.,
2003, p.306).
Vickerman (2000) describes the difficulties involved in including environmental and other concerns into
cost-benefit analysis procedures for transport, as experienced in the UK’s replacement of its relatively
simple cost-benefit analysis system (COBA) with a New Approach to Appraisal (NATA). In 2007, with
the launch of NATA Refresh, the NATA framework adopted in the 1998 White Paper (UK DETR,
1998) was put under review, to bring the appraisal process in line with evidence in the Stern Review
(Stern, 2006) and the Eddington Report (Eddington, 2006) on the links between transport and climate
change as well as the economy as a whole (UK DfT, 2009c). Appropriate valuation of environmental
costs is thus crucial for comparing the relative benefits and costs of investments in road and rail
transport.
5.3 Concluding remarks
While it is important to consider induced demand, the mere existence of this effect does not militate
against the construction or expansion of roads. Rather, the conclusion for road construction policy is that
a full social cost-benefit analysis should be conducted for each road scheme proposal, taking into account
all costs and benefits, and following the latest best practice, such as for example, the NATA Refresh in
the UK.
6. Freight modal shift
The share of goods transported by rail has declined in the last thirty years in favour of road transport. In
most European and Asian countries road is the main mode of freight transport, but this is not true for the
US. Road transport is much more polluting than rail per tonne-km of goods transported and therefore a
shift towards greater use of rail in freight transport is desirable.
However, to face modern logistics challenges, rail will need to become more nimble. This requires
adequate infrastructure, including railroads, and intermodal terminals to speed up and reduce the cost of
transport. Government intervention and industry co-operation will be at the forefront of these changes
and this section assesses policies which will potentially have an impact on the modal shift of freight from
road to rail.
6.1 Global perspective
Transport accounts for 23 per cent of global CO 2 emissions, up from 20 per cent in 1971 (IEA, 2008a).
About 35 per cent of these emissions come from freight transport (Kahn Ribeiro et al., 2007)20. 95 per
cent of global transport relies on oil and accounts for 60 per cent of global oil emissions. CO 2 emissions
from oil consumption in transport doubled between 1971 and 2008, whereas in most other sectors these
emissions remained roughly constant (IEA, 2008a, p.xxiv).
The freight share of CO2 emissions in transport in OECD countries has been increasing relative to the
passenger share in recent years and has therefore become a focus of policy-makers (OECD, 2002, p.28).
In particular, for most developed countries (Western Europe, US, Canada and Australia) road freight
transport contributes between 20 per cent and 30 per cent of total road transport CO 2 emissions and this
share is expected to grow in the future (OECD, 2002, p.25).
6.2 Potential of rail
In the EU-25 road freight, measured in tonne-km, increased by 37.9 per cent between 1995 and 2005; rail
performed much more poorly with only a 9.2 per cent growth over the same period, which is far below
the overall transport growth of 35 per cent. In 2005 in the EU-25 rail accounted for only 10 per cent and
road accounted for 44.2 per cent of total freight transport (Eurostat, 2007, Figure 1.3, p.5). These
numbers are in stark contrast to the US, where road and rail account for 34.4 per cent and 31.1 per cent
of commercial freight activity respectively (US DoT, 2006). In China the situation is somewhat different.
20 In fact Kahn Ribeiro et al. (2007, p.328) report that 35 per cent of ener gy is used by freight transport. But ‘one consequence of [oil]
dependence, coupled with the only moderate differences in carbon content of the various oil -based fuels, is that the CO2 emissions from the
different transport sub-sectors are approximately proportional to their energy use’.
The rail share in freight transport has fallen since 1980, from 47.5 per cent to 30.7 per cent, road has
doubled its share to 13.4 per cent, and waterways make up the rest (Skeer and Wang, 2006). But rail is not
only a viable alternative for vast countries, such as China and the US: Lithuania’s freight rail share is 60
per cent larger than its road share (Eurostat, 2007, p.77).
In terms of emissions rail is far superior to road transport. Most studies confirm that rail produces half as
much CO2 as road transport does per tonne-km of goods carried over the life cycle, and for CO, NOx and
particulate matter rail fares even better (Facanha and Horvath, 2006). According to other studies, rail is
over seventeen times less energy-intensive (measured by CO2 per tonne-km) than light duty road vehicles
and four times less energy intensive than heavy duty road vehicles (EEA, 2005, Table 1, p.10 and ECMT,
2007, Table 3.5, p.47). How effective would a modal shift to rail be? The same report states that ‘a 5 per
cent per year increase in EU-15 rail freight between 2005 and 2010 would be required to achieve a 1 per
cent reduction in CO2 emissions’ (ECMT, 2007, p.47).
Rail is also more economically efficient. Forkenbrock (2001) estimates the external costs of four
representative types of freight trains in the US. The external costs he considers include accidents
(fatalities, injuries, and property damage), emissions (air pollution and greenhouse gases) and noise. He
finds that rail external costs are 0.25 cents of US$ per ton-mile, well below the external costs from road
freight, which he estimates at 1.11 cents of US$ per ton-mile. However, because rail is much cheaper
(between three and eight times), rail external costs are larger relative to private costs.
Finally, road freight transport causes substantial waste with empty lorries. In the UK, for example, despite
its relative small area and sophisticated logistics, the proportion of lorry-km run empty has decreased to
26.5 per cent and the potential to reducing this further is quite small (McKinnon and Ge, 2006). A shift
from road to rail transport would potentially reduce this waste. However, this depends crucially on
improvement in the logistics of the rail freight transport. Dinwoodie (2006) found that rail freight output
from Plymouth, UK, could be trebled and unit costs could be cut further. The inefficiency caused by
running empty trains poses a difficult logistical challenge, because, unlike lorries, they cannot be simply
re-routed to another loading destination.
6.2.1 Why is rail losing its share?
Rail is a cheaper way to carry freight and produces fewer emissions, but companies are reluctant to adopt
it and governments seem unable to reverse the shift away from rail transport. Total logistics costs in the
US fell from 16 per cent of GDP in 1980 to 9.9 per cent of GDP in 1999, mainly due the rise of efficient
truckload operations (ICF Consulting, 2002, p.11, Exhibit 12A). Only 15 per cent of surveyed German
freight companies shifted to rail or ship between 1998 and 2003 (ECMT, 2007). The reasons usually
mentioned in the literature include the following:
Rail is not necessarily cheaper beyond the tonne-mile cost to the firms. Firms attempt to cut
costs by reducing the amount of stock they hold and creating just-in-time assembly lines, which
streamline production (Woodburn, 2003). This means that they require small and frequent
delivery of inputs, which is only possibly by delivery lorries. ICF Consulting (2002) argue that
between 1980 and 2000 firms in the US substituted transport spending for inventory spending,
which further increased demand for fast trucking services.
Road transport is faster and more flexible than rail, which means that fuel costs become relatively
unimportant (Schipper and Fulton, 2003). The reason for this is that road infrastructure is far
more extensive and open. Firms can choose their open means of transport and optimise their
deliveries over any vehicle number or size. Rail transport only offers to carry vast amounts of
goods in predetermined carriers and is being used to carry goods over greater distances than
road. In the UK the average length of rail freight haul has increased slowly between 1995 and
2005 to over 200 km, whereas the average road haul has remained steady at around 90 km (UK
DfT, 2006).
Lack of inter-modality makes rail freight transport a virtual impossibility for most firms. A vast
majority of firms (apart from coal power stations) do not have direct rail links. Therefore, if they
switch to rail, they would rely on another type of transport (it is likely to be road) to deliver the
goods from the rail hub to them. However, many costly infrastructural difficulties arise when
designing these inter-modal freight terminals (Ferreira and Sigut, 1993), including lifting
equipment and track layout. In addition to that, efficient information systems for inter-modal
transport with rail have only begun to emerge in recent years (Macharis and Bontekoning, 2004).
First, improved train reliability, reduced disruption and damage would certainly aid the
development of sophisticated operational systems, which will make it worthwhile for firms to use
some rail transport. Second, container transport is not only cheaper and more feasible for
intermodal links, but may also be able to handle frequent transport of small or fragile
commodities (Iwasa, 2001).
6.2.2 Initiatives for a modal shift from road to rail
Given the advantages of rail for reducing emissions and road congestion which were outlined above,
governments have introduced a variety of schemes to encourage firms to shift freight from road to rail.
Here we briefly describe a couple of initiatives in Europe and a Canadian initiative.
The trans-European Network (TEN) was conceived by the European Commission in 1992 as part of the
Maastricht Treaty. This policy ‘aim[s] at promoting the interconnection and inter-operability of national
networks as well as access to such networks’ (Maastricht Treaty, p.31, Article 129b). At least 55 per cent
of its funding is allocated to rail projects (Henstra et al., 2007, p.148). However, support for investment in
rail infrastructure on its own is not likely to affect the modal split. The program was quite unsuccessful in
reversing the trend towards road transport and it appears that this was due to a lack of focus on intermodal operations, which are crucial to the success of rail (Sichelschmidt, 1999).
The Marco Polo Programme, established by the European Commission in 2003, specifically addresses the
issue of modal shift. To achieve its goal of taking 12 billion tonne km of freight and passengers off the
road, it offers a subsidy of €2 (£1.8, $2.6) for each tonne km shifted to rail, short-sea or inland waterways
(Psaraftis, 2005; US DoE, EIA, 2009). More than half of its self-selected best projects are directed at
passenger and freight modal shift. Now in its second phase, with a budget of €450 million (£405m,
$592m) between 2007 and 2013, Marco Polo approved 28 projects in 2008. Little quantitative research
has been done for Marco Polo projects, but it claims to generate €6 of social and environmental benefits
for every Euro it invests.
Moving on to Canada, its freight sector contributes 9.3 per cent to overall CO 2 emissions, but only 6.3 per
cent to the country’s GDP. Despite an overall increase in freight emissions of 145 per cent between 1990
and 2003, rail emissions fell by 15 per cent and, while carrying 40 per cent of freight, rail only contributes
8.3 per cent of CO2 (Steenhof et al., 2006).
Canada has recently been concentrating on improving its inter-modal rail services. It has been particularly
important to improve rail links with ports, as Canada is becoming a prime transit destination for Chinese
export bound for the US (Jones, 2005). For example, federal and municipal governments financed 35 per
cent of a CA$173 million (£96m, $157m, €111m) project for a new inter-modal container terminal in
Prince Rupert on the Pacific coastline. When finished, the project will connect the port to Chicago and
the US Mid-west with daily intermodal trains (Jones, 2005; Steenhof et al., 2006).
If rail can re-gain its 1990-1992 market share of 49 per cent together with predictable improvements in
locomotive efficiency, Canada’s freight sector emissions could be reduced by 10 per cent by the year 2012
(Steenhof et al., 2006). Hence a modal shift of 10 per cent into rail can produce a 1 per cent fall in overall
CO2 emissions. There is a note of caution in this example, which reflects a similar caveat in free public
transport provision. In order to bring about a significant reduction in CO 2 emissions, rail must induce a
shift from more polluting modes of transport, such as road. In 1995 the Dutch government began to
construct the Betuwe rail line from Rotterdam to the border with Germany. The intentions seemed
plausible: the government wanted to improve the multi-modality and competitiveness of Rotterdam port
and take freight away from the road. However, as Priemus (2007) points out, the government failed to
take into account the relevant alternatives, such as increasing inland shipping along the Rhine and Maas,
before spending over €4.8bn (£4.3bn, $6.3bn) on the rail line. Inland shipping has a strong economic and
environmental advantage over rail in the Netherlands due to the existence of excellent natural waterways.
Indeed, there is likely to be unnecessary competition between rail and inland shipping along the route and
the environmental contribution of the rail line will be at best modest (van Ierland et al., 2000).
6.3 Concluding remarks
This short section has introduced some of the relevant issues around the possibility of the shift from road
to freight transport. It is not only feasible in large countries, but also in smaller ones. There are still many
logistical challenges, and it remains to be seen whether rail can adapt to efficient transport in the future.
7. Developing countries
Developing countries will play a central role in the low-carbon economy of the future. The population of
developed countries is projected to start falling around 2030 and virtually all additional population
between 2010 and 2050 will come from developing countries (UN Secretariat, 2007). Per capita emissions
in most of the developing world were between 0 and 5 tonnes of CO 2 compared to 9.4 in the UK and
20.4 tonnes the US in 2004 (UNSD, 2007). Developing countries accounted for 41 per cent of global
CO2 emissions in 2004, but their population and per capita emissions growth means that they contributed
73 per cent of global emissions growth (Raupach et al., 2007).
In 2003 there were six passenger cars per 1000 people in low-income countries compared with 433 cars
per 1000 people in the developed world (World Bank, 2006). In 2007 low and middle income countries
grew 8.1 per cent compared to a meagre 2.5 per cent growth in high-income countries (World Bank,
2009). High income elasticity of demand for cars in developing countries means that car ownership will
grow there even faster than income in the nearest future (Dargay and Gately, 1999). OECD countries had
three times as many vehicles as non-OECD countries in 2002, but by 2030 the non-OECD countries will
have overtaken by over 200 million vehicles (Dargay et al., 2007, p.161). The motorisation of developing
countries will thus put a strain on global efforts to cut carbon emissions from transport.
The situation is much more complicated, however. The condition of road and public transport
infrastructure in developing countries is dire. Over a billion people in the world, who live in rural areas,
have no adequate access to the transport system and only 13 per cent of roads in low-income countries
are paved (compared to 91.8 per cent in high income countries) (World Bank, 2006, Table 5.8). Poor
road, rail and telecommunication infrastructure increases transport costs and reduces trade volumes
(Limao and Venables, 2001) and trade is an important determinant of income (Frankel and Romer, 1999).
Therefore, improving road conditions and investing into road and rail networks will be a key factor in
increasing economic growth in developing countries. Additionally, roads and public transport increase
rural populations’ access to work, education and healthcare. The welfare effects of this can be vast,
compared to the environmental and social costs. To this extent, there is a clear contrast with policy
recommendations for developed countries, where building more roads would induce more traffic without
relieving congestion or improving travel times in the long-run.
However, the strategy of building more roads will not be sustainable in the urban areas of developing
countries. The urban population in developing countries will more than double between 2010 and 2050,
whereas the rural population will shrink by about 15 per cent over the same period (UN Secretariat,
2007). High population densities in newly-developing cities have already created unprecedented
congestion. 30 of the most air-polluted cities in the world, measured by concentration of particulate
matter, sulphur dioxide and nitrogen dioxide, are in low- and middle-income countries (World Bank,
2007). There is substantial potential for successful land use and public transport policies to reduce car use.
Investing into sustainable transport will allow these cities to grow and develop efficiently; reduce
healthcare and traffic delay costs and decrease CO 2 emissions.
The challenge of creating a sustainable transport infrastructure in developing countries is daunting. Lowincome countries often lack the financial resources and governance systems for developing an
infrastructure for low-carbon transport. Development banks have stepped in to assist: the World Bank
has dedicated around 15-20 per cent of its portfolio to transport projects in recent years (Khandker and
Bakht, 2009). But governments of these countries often view sustainable transport as a hindrance to the
acceleration of economic growth. This section will discuss the affordable policies, which will challenge
this view.
7.1 Rural areas
7.1.1 Roads
As we argue in Section 5, building more roads in developed countries does not help to relieve congestion
in the long-run and is therefore not an effective road transport policy. However, this policy
recommendation stands in stark contrast with the need for additional road infrastructure in developing
countries. In sub-Saharan Africa only one in eight roads is paved and in all low- and middle-income
countries the figure still represents only 29.5 per cent (World Bank, 2006, table 5.8). A large body of
literature confirms that in developing countries the welfare benefits of building paved roads outweighs
environmental and congestion costs. In fact, there is evidence of decreasing returns from road
construction: the poorest people tend to benefit most from these projects and the economic returns for
the most isolated projects are highest (Papua New Guinea: Gibson and Rozelle, 2003; Vietnam: Mu and
van de Walle, 2007; Bangladesh: Khandker and Bakht, 2009). The benefits of rural road construction in
developing countries are multi-dimensional and self-reinforcing. First, better roads reduce trade costs.
Individual agricultural producers gain quicker and cheaper access to market and firms are able to deliver
their products to consumers. Limao and Venables (2001) find that poor infrastructure can account for as
much as 60 per cent of transport costs in landlocked countries and 40 per cent in coastal countries. Buys
et al. (2006) estimate that an initial investment of $20bn (and annual maintenance expenditure of $1bn)
would increase trade in sub-Saharan Africa by $250bn over the next 15 years. Second, roads provide
better access to opportunities in the higher-paying urban labour market and off-farm employment (Mu
and van de Walle, 2007). For example, reducing trade costs by $75 per ton increased incomes of the
poorest people in rural Madagascar by 50 per cent, which mainly came from non-farm earnings in towns
(Jacoby and Minten, 2009). A recent analysis of two road improvement project areas in Bangladesh
showed that consumption rose by between 8 per cent and 10 per cent (Khandker and Bakht, 2009).
Third, roads may have impacts on other measurements of human welfare, although some are ambiguous
and can be difficult to quantify (van de Walle, 2002). Lokshin and Yemtsov (2005) find that in Georgia
road construction ‘unambiguously’ improved access to emergency healthcare. One ought to be cautious,
however, since roads not only increase the mobility of humans, but also of disease (HIV rates in Kenya,
for example, are higher in places with better access to roads (Yamano and Jayne, 2005, pp. 634-635).
Effects of rural roads on education are similarly nuanced. There is evidence that better access to school
reduces teacher absenteeism (Kremer et al., 2005) and primary school completion rates (Mu and van de
Walle, 2007), but the verdict on precise returns to education has not yet been reached. Finally, the effect
of roads on women’s mobility and social inclusion can be particularly pronounced. Women in developing
countries tend to be more disadvantaged in their mobility then men and are more burdened with
transporting goods to and from households, often by head-loading (Porter, 2002).
Although the issues of accidents, environmental degradation, crime, and diseases cannot be neglected
when evaluating impacts of roads on poor rural communities in developing countries, they appear to be
more than outweighed by the economic and social benefits that roads bring. Yet development of rural
infrastructure must look ahead and apply successful sustainable transport policies to the newly-built
roads.
7.1.2 Sustainable rural transport
As incomes grow in rural areas and road infrastructure is developed, road traffic will be induced. People
will switch from traditional modes of transport, such as walking and cycling, into driving. This will
eventually result in congestion and high carbon emissions, due to the fact that people in rural areas need
to travel further to their destinations. Sustainable transport measures must be introduced in the rural areas
of developing countries without hampering human mobility and welfare.
Almost no empirical work has been done on the impact of sustainable transport in the rural areas of
developing countries, probably because its actual availability is so poor. Here we briefly discuss some
examples of implementation and ideas for policy.
Public transport – this primarily takes the form of infrequent and long-distance small and large services
to the city. Buses and other forms of public transport exist primarily between farms, but are expensive to
operate due to poor refuelling and road maintenance conditions (Njenga and Davis, 2003) Additionally,
because of low population densities (particularly in Africa), many governments do not consider rural
public transport at all worthwhile. Starkey et al. (2002) point out that buses are ‘most cost-effective when
[at] full loads over long-distances…but they may be inappropriate for poor dispersed rural communities’.
However, in an analysis of three Chinese villages by Dalkmann et al. (2008), buses seem to provide
invaluable social and economic benefits to residents.
Motorcycles – an excellent example of a sustainable motorised transport is the boda boda in Uganda and
Kenya. Boda boda is a small two-wheel motorcycle, usually with a 50cc engine, which evolved from a
simple bicycle taxi. There are approximately 200,000 boda boda in Uganda and their number continues to
increase, according to Howe and Davis (2002), who also report that ‘about 60 per cent of male and 38 per
cent of female users say that use of boda boda services has resulted in increased income’ due to increased
accessibility.
Car sharing – although formal car clubs are virtually non-existent in developing countries due to
communication constraints, there is quite a large potential for them (Shaheen and Cohen, 2007). This is
especially the case because informal car sharing must exist on a vast scale in small rural communities,
particularly in those with better road access and higher social capital (as do some kibbutzim in Israel). The
fixed cost of a car is usually too high for people in the rural areas of developing countries and poor access
to credit markets compounds the problem (it is outside of the scope of microcredit).
7.2 Urban mobility
Urban mobility in developing countries faces a number of problems, primarily as a consequence of two
key developments: urbanisation and motorisation. Many developing countries are experiencing more than
6 per cent urban population growth per year and within a generation more than half of the population in
the developing world is expected to live in cities (Gwilliam, 2002, p.5). Figure 2 shows past and projected
percentage of urban population in the world and in more and less developed regions in the period 1950 2050.
Figure 2: Percentage of urban population 1950 - 2050
Source: UN Secretariat (2007)
Urbanisation in itself should not be considered the problem, as it is central to economic growth in
developing countries. Gwilliam (2002) thus notes that ‘it has been argued that cities are the engines of
economic growth in most developing countries, and that urban transport is the oil that prevents the
engine from seizing up’ (p.22). Particularly in megacities, however, transport problems are already having
detrimental effects on the economy and further urbanisation is likely to be similarly unsustainable, with
the number of megacities (cities with more than 10 million inhabitants) expected to double within a
generation. Urban growth is thus likely to consist of urban sprawl, which is highly problematic since it
‘militates against adequate public transport service supply, encourages auto dependence, and hence
reduces accessibility to employment and to urban facilities for the poor and very poor’ (Gwilliam, 2002,
p.5). Rapid motorisation, with per capita motor vehicle ownership increasing by up to 15-20 per cent in
some developing countries, is thus reinforced by the form of urban growth.
Urbanisation, in the form of urban sprawl, and motorisation are the key factors driving the mobility
challenge facing developing countries. As outlined above, the phenomena of urbanisation and
motorisation are interlinked, and together they are at the heart of a number of connected problems along
several dimensions shown in Figure 3. We now turn our attention to outlining the problems and
determining potential policy remedies for achieving sustainable urban transport in developing countries.
Figure 3: Dimensions of the urban mobility challenge in developing countries
Economic
Social
Environmental
Health
7.2.1 Urban transport in developing countries: the problems
The problems relating to urban transport are many, multidimensional, and interlinked, as depicted in
Figure 3. For instance, pollution is a problem mainly along the dimensions of the environment and
health, but it is also linked to congestion (as congestion aggravates pollution) and social exclusion (as
people from the most disadvantaged groups tend to be disproportionately exposed to pollutants from
transport).
7.2.1.1 Congestion
Developing countries are experiencing rapid motorisation accompanying growth in incomes; however,
the number of cars per capita is still relatively low. For every 1000 people there are less than 100 cars in
most developing countries, whereas the equivalent number in richer industrialized countries is in excess
of 400. However, cities in developing countries suffer from severe congestion, which Gwilliam (2003,
p.198) refers to as “premature congestion”, given that it is occurring at relatively low levels of
motorisation. In downtown Bangkok, Manila, Mexico City, and Shanghai weekday traffic speeds average
10 kilometres per hour or less, and 15 kilometres or less in Kuala Lumpur and Sao Paolo (Gwilliam, 2002,
p.7). In addition to the economic cost of long commuting times, GDP growth in large cities such as
Manila, Mexico City or Sao Paolo is also reduced by ‘freight congestion, delays and unpredictability,
difficulties of conducting business, and increasing signs of disarticulation of the labor market’ Gwilliam,
2002, p.8). Since congestion exacerbates emissions, Molina and Molina (2004, p.3) note that measures to
reduce traffic congestion have been applied in order to reduce motor vehicle emissions with varying
degrees of success.
7.2.1.2 Pollution
From a global perspective, the potential rise in CO 2 emissions from developing countries is particularly
troublesome, and Wright and Fulton (2005) thus note that ‘the spectre of rapidly growing private vehicle
ownership and usage in developing nations casts a worrying shadow over the projected course of global
greenhouse gas emissions’ (Wright and Fulton, 2005, p.691). In contrast to cities in developed countries,
however, local air pollution is still a major concern in developing countries. Gwilliam (2003) thus reports
that while WHO studies of megacities in developing countries only observe serious lead excesses in the
diminishing number of cities where leaded gasoline is used, excesses of fine particulate matter, on the
other hand, are ‘widespread and large’ (Gwilliam, 2003, p.1999). The effects of this along the health
dimension are stark, as ‘local air pollution from transport in developing countries contributes to the
premature deaths of over 500,000 people per year’ (Gwilliam, 2002, p.xvii).
7.2.1.3 Safety and Security Problems
Road traffic accidents are among the leading causes of death and disability worldwide. More than 1.2
million people die each year on the world’s roads, with between 20 and 50 million suffering non-fatal
injuries (WHO, 2009, p.vii). The WHO predicts that road traffic injuries will rise from ninth to fifth place
between 2004 and 2030 in their ranking of the world’s leading causes of death (WHO 2009, p.ix). Road
traffic fatality rates for low- and middle-income countries (21.5 and 19.5 fatalities per 100 000 population
respectively) are higher than in high-income countries (reporting 10.3 per 100 000). Developing countries
are disproportionately affected by the problem, as over 90 per cent of road-related deaths occur in lowand middle-income countries, even though these countries have just 48 per cent of the world’s registered
vehicles (WHO, 2009, p.vii). Vulnerable road users (including pedestrians, cyclists, and users of motorised
two-wheelers) are particularly at risk in developing countries, where they make up the majority of
fatalities. In low- and middle-income countries of the Western Pacific Region, for instance, vulnerable
road users account for 70 per cent of road deaths (WHO, 2009, p.viii). Given this, it is not surprising that
the problem also has a further social dimension with poor people being disproportionately affected by
road traffic injuries (WHO, 2009, p.2). Security problems are also most common in low-income
settlements, with public transport users and particularly pedestrians ‘increasingly likely to suffer violent
attacks’ (Gwilliam, 2003, p.207). A case study of Cisne Dos (Ecuador) in 1992, for instance, revealed that
over a six-month period one in five women were robbed on a bus, with one woman in two being witness
to such an attack, such that ‘the lack of safe transport during off-peak hours has caused girls, generally
from the poorest families, to drop out of night school’ (Moser, 1996, p.15). Safety and security issues are
thus undoubtedly closely linked to the problem of social exclusion.
7.2.1.4 Social Exclusion
In developing cities, deteriorating urban transport disproportionately affects poor people, who tend to
live either on the sprawling city periphery or in harsh inner-city areas, ‘with very poor access by the only
modes of transport available to them, walking, non-motorized or public transport’ (Gwilliam, 2003,
p.201). As a result, people living in these large, sprawling cities face long commuting times, with 20 per
cent of workers in Mexico City commuting more than 3 hours every day, and 10 per cent even spending
more than 5 hours to get to and from work (Schwela and Zali, 1999, in Banister, 2005). The problem of
social exclusion is linked to the other issues discussed above, as ‘poor people also suffer
disproportionately from deterioration of the environment, safety, and security because they are
locationally and vocationally most exposed, and less able to afford preventative or remedial action’
(Gwilliam, 2002, p.25). Banister (2005) notes that sustainable urban development tends to be primarily
seen as a social, rather than an environmental construct in developing countries, focusing on ‘levels of
accessibility, the use of non-motorized forms of transport, the location of homes and jobs, and the high
level of accidents’ (Banister, 2005, p.193). Given the close connections between the different problems
relating to urban transport, policies are likely to have impacts along several dimensions, i.e. policies for
reducing congestion may have environmental, economic, as well as social benefits. Environmental and
social sustainability can thus go hand-in-hand.
7.2.2 Urban transport in developing countries: an integrated policy approach
As those who can afford them increasingly rely on private vehicles, developing countries have
experienced a substantial drop in the share of public transport; many cities have even recorded an
absolute decrease in the number of trips made by public transport and the consequent decline in urban
public transport service levels affects those reliant on public transport particularly severely. Wright and
Fulton (2005, p.694) report annual decreases in the mode share of public transport between 0.2 and 1.4
per cent in a number of surveyed cities and note that poor transport services are pushing consumers
towards private vehicles, an almost inevitable development ‘if public transport is too slow, uncomfortable,
unsafe, insecure and lacking in status’ (Wright and Fulton, 2005, p.694). Similarly, poor quality pedestrian
infrastructure leads people to choose motorised modes of transport even for very short distances, as
observed in some Asian cities (Hook, 2000, in Wright and Fulton, 2005, p.694). Gwilliam (2003, p.201)
thus notes that in India less than half of the major roads have pavements in most cities, and even where
they do exist they are often blocked by street vendors or parked vehicles. Government policies are also
playing a role in the decline of non-motorised transport: in Indonesia, public authorities ‘have taken
positive actions to eliminate non-motorized public transport’ (Gwilliam, 2003, p.201) and bicycles have
been banned from parts of some Chinese cities (Wright and Fulton, 2005, p.697).
While transport in the cities of developing countries appears to be on an increasingly unsustainable path,
Wright and Fulton note that ‘most developing-nation cities still possess the basis for a more sustainable
future’ (Wright and Fulton, 2005, pp.691). In developing countries the mode shares of public transport as
well as of walking and cycling are still high, unlike in developed countries. Policy thus needs not try to
achieve a modal shift, but rather preserve the existing modal shares (Wright and Fulton, 2005, p.692).
Integrated transport and land use policies have been successfully implemented in cities such as Curitiba or
Bogota. In particular combining the following policies can play a key role:
improving public transport and necessary infrastructure
providing better infrastructure for walking and cycling, and improving enforcement
moving towards more sustainable land use patterns, integrated with transport policy
A wide range of policies on the basis of an integrated land use and transport structure plan have been
central to the successful management of the relationship between transport and land use both in Curitiba
and Singapore (Gwilliam, 2003, p.202). Cities in developing countries have an advantage in often still
being quite dense with mixed-use development, features favourable to public transport as well as walking
and cycling. The challenge for these cities lies in improving their transport systems ‘in order to preserve
the market share of low-emitting modes’ (Wright and Fulton, 2005, pp.696-7). Gwilliam (2003, p.212)
describes non-motorised transport as ‘the neglected Cinderella of transport modes’, being physically
vulnerable to, and often poorly protected from motorised traffic. A comprehensive approach such as the
cycle master plan in Bogota, providing segregated infrastructure without major intersections with
motorised traffic as well as secure bicycle parking, is necessary to help make cycling safer and more
attractive (Gwilliam, 2003, p.212).
In conclusion, an integrated transport and land use policy can help set cities in developing countries on
the path towards a more sustainable future, addressing the multiple mobility challenges faced by these
cities along multiple dimensions, ranging from environmental and economic, to health and social issues.
Soft policies
8. Teleworking and teleshopping
Technological innovation in telecommunications has presented two exciting possibilities in sustainable
transport policy: teleworking and teleshopping.
Teleworking (also known as telecommuting) is the practice of ‘working away from the traditional office
using computers and telecommunications facilities to maintain a link to the office’ (Bélanger and Collins,
1998, in Bélanger, 1999, p.139). Teleworking can potentially reduce congestion and improve air quality if
employees do not need to travel to work. Teleconferencing, also eliminates the need for several people to
travel to the same location - avoiding flying to another continent for example - in order to have a business
meeting.
The Oxford English Dictionary defines ‘teleshopping’ as ‘a method of ordering goods from shops by
electronic means’. Teleshopping does not only provide an opportunity to make purchases remotely, but
also to carry out research about potential purchases without visiting any stores. Although the shopper
may not make the trip to the store, the good still needs to be delivered; however, even this is changing
since many goods, such as books and music, can be purchased online in electronic format.
8.1 Teleworking
The practice of teleworking was identified in the 1970s and 1980s and it was initially thought that around
40 per cent of the workforce were potential teleworkers (Nilles, 1988). The obvious benefits for
teleworkers are a better work-life balance and lower commuting stress and costs (Bailey and Kurland,
2002), whereas businesses would enjoy lower real estate costs and higher productivity (Bélanger, 1999).
For this reason 37 per cent of employers in the US offered a teleworking arrangement in 2001, up from
20 per cent in 1997 (Potter, 2003). However, these results proved too optimistic (Mokhtarian, 1991) recent surveys indicate that teleworkers constitute an impressive 25 per cent of the labour force in the US,
around 15 per cent in Sweden, Finland and the Netherlands, around 5 to 8 per cent in the UK, Japan and
Germany, but less than 5 per cent in Italy, Ireland and Spain (Harpaz, 2002; Hotopp, 2002; Higa and
Wijanayake, 1998)21. One reason seems to be that researchers have underestimated the importance of
complex social interactions in the take-up of technology (Salomon, 1998). The other reason is the
following: if employers know that their employees can work away from their desks, they are likely to give
them more work without increasing their salary. Workers feel that even the potential of teleworking puts
them into a position to be exploited in this way and are therefore reluctant to take up teleworking
arrangements (Bélanger and Collins, 1998). Janelle (2004, p.104) notes that ‘concerns over low job
security, few worker benefits, and poor prospects for job advancement are at the root of labor union
opposition to widespread adoption of teleworking’. Finally, not all employers feel that they can monitor
their teleworking employees as well as office-based employees. Nevertheless, the potential for teleworking
is great in Europe - Banister and Stead (2004) estimate it at approximately 20 per cent for most EU
countries.
Focusing on the role of teleworking in sustainable transport, we can argue that, in principle, if workers do
not commute to work, they do not contribute to congestion. Mokhtarian (1997) estimates that a 2 per
cent increase in teleworking would cause a 1 to 2 per cent decrease in total personal vehicle travel. But
recent studies in the US estimate that telecommuting reduces total vehicle miles travelled by only 0.8 per
cent (Choo et al., 2005). The reason is that there are ‘rebound’ effects: other household members may be
using the teleworker’s car or the teleworker may need to make additional errand trips (Cairns et al., 2004).
In effect, freed up roads may be taken up by other vehicles (Gross et al 2009), so the impact on
congestion and associated time savings be quite small. Alternatively, workers, who only telework two or
three days a week and drive to the office on other days, may choose to live further away from the
workplace (Janelle, 2004, p.107). Thus, although they will drive less often, they may end up driving more
overall. However, there are some encouraging results from implementing teleworking, particularly in
cities. In Tokyo, for example, by 2010 congestion will be reduced by as much as 11 per cent due to
teleworking (Mitomo and Jitsuzumi, 1999), which in economic terms is equivalent to a quarter of public
transport spending.
The effect of teleworking on carbon emissions, pollution and energy are more ambiguous. The difference
between the cost of heating and electrical equipment at home and in the office may be higher than the
emissions saved from a short car or public transport commute. National energy savings in the US and
Japan from teleworking are at most 0.4 per cent (Matthews and Williams, 2005).
Kitou and Horvath (2006) estimate that overall emissions (CO 2, NOx, SO2) from teleworking are lower
than usual commuting if the commute is longer than 8 km. This also means that teleworking will mitigate
the environmental impact of increasing urban sprawl, as more people living far out are choosing to
telework (Ory and Mokhtarian, 2006). Overall, teleworking appears to have some potential for reducing
carbon emissions in developed countries if the current trends continue - in the UK 2.4 per cent of carbon
emissions from cars may be reduced due to teleworking by 2050 (Anderson, 2003, in Gross et al., 2009)
and in the US the national energy savings will be at most 1 per cent in an optimistic scenario (Matthews
21 Teleworking is notoriously difficult to measure and so cross-country comparisons are prone to measurement error. Here we consider
teleworkers to be those workers who spend some time working remotely (at least one day a month, either at home or at a satellite office). There is
another category of workers, who only work from home - the so-called teleworker-homeworkers.
and Williams, 2005). However, since most teleworkers are in managerial and professional occupations
(Hotopp, 2002) this potential for energy saving and pollution reduction may be limited in developing
countries.
8.2 Teleconferencing
Teleconferencing technology allows several people to communicate via voice and video links, avoiding
face-to-face meetings. Teleconferencing, like telegraph and telephone before it, will not replace face-toface meetings completely - instead it acts as a complement to meetings (Banister and Stead, 2004).
Teleconferencing allows people to communicate faster and this means more business can be done. There
are strong psychological reasons for why some face-to-face meetings cannot be avoided (Storper and
Venables, 2004), which explains why the amount of travel for face-to-face meetings has not decreased.
However, teleconferencing has the potential to substitute some face-to-face meetings (such as meetings
within companies, regular conferences, interviews) and cut costs within organisations, where the number
of social contacts is fixed in the short-run. The main barrier to teleconferencing today is the fact that its
technology has not been implemented on a wide scale. Sophisticated teleconferencing technologies are
expensive (a recent, advanced personal teleconferencing module from Cisco costs $33,900 (£23,200,
€25,700), do not have cross-platform compatibility and so can only be justified by large international
firms. Nevertheless, adopters of teleconferencing technologies report considerable benefits. For example,
BT avoids over 338,600 meetings a year, 42 per cent of trips which would have been made by car, saving
at least 52,000 tonnes of CO2 with conferencing technology. BT saves around £81 million in travel and
subsistence, and gains £54 million in opportunity benefits, with total benefits of £135 million ($200m,
€150m) per year from conference calls. The conferencing costs only amounts to 10 to 15 per cent of the
benefits (James and Hopkinson, 2006, p.4).
8.3 Teleshopping
Teleshopping (online shopping, e-shopping or e-commerce) allows customers to compare and purchase
products online. 73 per cent of households in the UK ordered goods by internet, phone or post for
delivery in 2008 (Budd, 2009) Although many more products, such as books and music, are becoming
digitised and therefore do not require physical delivery, some products, such as groceries and television
sets, need to be delivered to the customer. We now briefly discuss some second-order effects of
teleshopping, i.e. transport volume and emissions due to changes in freight structures and logistic chains
(Fichter, 2003), which will probably dominate changes in urban transport.
Early studies of book retailing in Japan argued that energy use associated with teleshopping is the same as
for traditional shopping (Williams and Tagami, 2003). However, later studies, for example of DVD
retailing in the US, showed the teleshopping alternative used 33 per cent less energy and up to 40 per cent
less CO2, mainly due to improved packaging (Sivaraman et al., 2007). Weltevreden and Rotem-Mindali
(2008) find support for both increased and decreased travel due to teleshopping in the literature and
Mokhtarian (2004) argues that although travel will increase, the magnitude of the effect is very difficult to
determine in general. This underlines the fact that the impact of teleshopping is changing constantly and
is responding to a variety of different factors including:
Modal split of shopping transport - if teleshopping substitutes a shopping trip that could be
made by foot, there will be a negative impact on congestion and emissions. For example, in the
US 6 per cent of the shopping trips are walked or cycled and 93 per cent are made by car or
motorcycle, whereas in the Netherlands the split is 48 per cent each (Weltevreden and RotemMindali, 2009), therefore the impact of increased teleshopping is more likely to be more positive
in the US.
Purpose of shopping trips and types of goods - the most popular items bought online, such as
books, CDs, DVDs, software, travel tickets and clothes, are usually bought together with other
goods on traditional shopping trips, whereas items, such as groceries, are usually bought on
purpose-specific trips (Weltevreden, 2007). Hence, buying groceries online typically leads to
fewer emissions.
Source of goods - teleshopping does not let the consumer control how and how far the goods
have travelled. Improved logistics has driven down transport costs and delivery times. This has
allowed firms to locate farther away from customers to reduce production costs. Many businesses
now choose airline delivery over rail and road freight (Matthews et al., 2001), which causes higher
carbon emissions.
Type of buyer-seller relationship - there appear to be mobility effects of business-to-consumer
(e.g. retailers, such as Amazon.com) and consumer-to-consumer (auction sites, such as
Ebay.com) teleshopping. Weltevreden and Rotem-Mindali (2008, 2009) find that shopping trips
and distance travelled fell by 0.3 and 0.39 per cent respectively as a result of teleshopping in the
Netherlands and freight transport trips increased by 0.3 per cent (mainly because of business-toconsumer teleshopping), leading to an overall reduction in total vehicle miles travelled. However,
once they break the results down, no obvious pattern emerges, which leads Weltevreden and
Rotem-Mindali (2009, p.90) to conclude that ‘e-shopping can have both a positive and negative
effect on mobility, depending on personal characteristics, the form of e-commerce, the modal
split, the level of trip chaining, and the type of products that are ordered online. Future studies
should take this into account when scrutinising the relationship between e-shopping and
transportation.’
Overall, the results suggest that teleshopping plays an ambiguous role in sustainable transport and its
effect in the future is quite difficult to predict.
8.4 Examples of successful implementation of teleworking
Teleworking initiatives have been implemented and studied in several cities and firms in the US and
Europe, but it is clear that a long-term, careful empirical analysis of the effects of teleworking on the
economy, transport and the environment has not yet been done. Most studies below consider an
introduction of a voluntary teleworking scheme at an organisation. The obvious problem with identifying
the causal impacts of teleworking will therefore be self-selection. Most data are collected using
questionnaires, some of which have a low return rate, and the quality of these questionnaires cannot be
ascertained. This may give rise to high degrees of measurement error. Additionally, sample sizes tend to
be very small, which also makes identification difficult.
The Netherlands Ministry of Transport teleworking experiment 1990
Location The Hague, Netherlands
Reasons 5% target in reduction of all peak hour traffic by 2015 by using teleworking set by The
Netherlands Transport Structure Plan
Size 30 teleworkers
Method Each teleworker was assigned a weekday on which to start teleworking. Questionnaires were
completed by the teleworking group and a control group of the same size over five waves. Waves were
three months apart.
Results 15 per cent decrease in the number of commuting trips made by teleworkers; 14 per cent
decrease in the number of other trips made by teleworkers; 9 per cent decrease in the number of trips
made by household members of the teleworkers; 20 per cent working time spent teleworking led to a 26
per cent decrease in the number of peak hour car trips made by teleworkers.
Source Hamer et al. (1991)
Cairns et al. (2004) provide a good summary and cite the following examples:
State of California Telecommuting Pilot Project 1988-1990
Location California, US
Reasons increasing costs of office space, worsening congestion and air quality, energy conservation.
Size 14 public agencies, which volunteered to participate and 40 teleworkers.
Method Teleworkers were asked to telework at least once during a three day travel diary period.
Results Transport: 27 per cent reduction in the number of personal vehicle trips and 77 per cent
decrease in vehicle-miles travelled. Emission reductions of: 48 per cent for total organic gases, 64 per cent
for carbon monoxide, 69 per cent for nitrogen oxide and 78 per cent for particulate matter.
Source Koenig et al. (1996)
Sustainable Teleworking (SusTel) 2002
Location UK (research was carried out in 5 other European countries)
Reasons difficult travel conditions, high property costs and prices, pressures for business efficiency,
demand for more flexible working hours from employees and improved communications
Size BT and BAA Heathrow with 199 and 20 questionnaires returned by teleworkers respectively. 4 other
smaller firms participated. We only report results for BT because of largest sample size.
Method Questionnaire
Results Transport: 89.6 per cent reported decrease in commuting, 64.7 per cent were saving 6 or more
hours a week on commuting, net weekly travel reductions per person of 193 miles. Economic benefits:
68.9 per cent report higher productivity, 57.8 per cent report higher total output, 66.5 per cent report
better concentration.
Source Hopkinson and James (2003)
Greater Munich
Location Munich, Germany
Reasons air quality in Munich
Size 37 teleworkers and 29 members of their households
Method questionnaire
Results Transport: all purpose total number of trips by teleworkers fell by 19 per cent; all purpose total
number of trips by household members fell by 14 per cent; reduction in traffic in central Munich by 2 per
cent due to teleworking.
Source Glogger et al. (2003) in Cairns et al. (2004)
Satellite Office Association of Japan study
Location Hokkaido, Tohoku, Kanto, Tokai, Kansai, Kyushu, Japan
Reasons crowded cities, long commuting time, and environmental degradation due to the presence of
industries in cities.
Size 1,134 usable responses from 463 organisations. Of them 35 are teleworkers who work in satellite
offices, shared by several firms (see Spinks, 1991 for a description); 26 are ordinary teleworkers; 18 are
mobile teleworker meaning that they work remotely at many locations.
Method Questionnaire
Results 44.2 per cent of teleworkers identified improvement of productivity as the most significant effect
of teleworking followed by relief from fatigue and stress of commuting with 32.2 per cent.
Source Higa and Wijayanayake (1998)
8.5 Concluding remarks
Despite the initial enthusiasm about teleworking, it has not quite delivered on its expectations. That is not
to say that it may not deliver in the future. Even where telecommunication technologies are present,
workers are unwilling to be away from their offices because they fear that they may have to do more work
of lesser value. The success of teleconferencing depends entirely on the new technologies and their
availability to the individuals and companies and is therefore quite difficult to predict.
Teleshopping has taken off dramatically in many developed countries, but its effects on the environment
are ambiguous. What is necessary to determine successful policies for teleworking, teleshopping, and
teleconferencing is a careful and contextual empirical analysis of each issue. This will allow us to place
them into a broad policy framework for sustainable mobility.
9. Car sharing and car clubs
Car sharing refers to the practice of sharing a privately-owned vehicle with someone else for a particular
trip (in North America it is also known as ‘car-pooling’). Informal schemes are quite common between
neighbours, family and friends: taking turns to pick children up from school or driving with your
neighbour to work. Depending on the arrangement, passengers may contribute to fuel costs borne by the
driver or offer to drive on another occasion. Firms and local governments may give incentives to their
employees to car share. As discussed below, some states in the US, have introduced separate HOV lanes
for cars with two persons or more.
A car club (confusingly known as ‘car sharing’ in North America) is a formal arrangement, which gives
club members access to a fleet of cars. These cars are owned by the car club and parked around the city
or the neighbourhood. On top of regular membership fees, members must pay for each hour and mile
they drive in club cars. This can be extremely convenient for someone who makes irregular car trips
because he would not need to bear the high costs of buying and maintaining a personal vehicle. Car clubs
can be small local enterprises, although recent years have seen growth in city-wide and international car
clubs with sophisticated electronic booking systems.
9.1 Car sharing
There has been a downward trend in vehicle occupancy in developed countries in the last thirty years. In
the UK and in the US the average car occupancy has stabilised at 1.6 persons per vehicle and for
commuting journeys the figure is 1.1, even though most cars have four seats (Hu and Reuscher, 2004,
Table 16, in Gross et al., 2009). The main reasons for the decline in car sharing are the decreasing fuel
costs, improved vehicle efficiency, smaller families, increased time commitments (Ferguson, 1997), and
higher demands for greater privacy, comfort and convenience (Levin, 1982). Car sharing peaked in the US
during fuel shortages in 1973-4, but has fallen since (Huang et al., 2000). This means that there is
substantial potential to increase car occupancy through appropriate incentives. In Europe car sharing can
potentially increase by 13 per cent (ICARO, 1999, in Gross et al., 2009). Reduced car occupancy has
contributed to increasing congestion and pollution levels. The extent to which car sharing and car clubs
can contribute to aggregate reductions in congestion and pollution levels has unfortunately not been
measured with an adequate degree of precision anywhere in the world (Gross et al., 2009). Despite its
potential, car sharing is not very popular and probably makes a small contribution to congestion
reduction. In the US, 92.4 per cent of work commutes are taken by private vehicle, but only 16.8 per cent
as high occupancy vehicles. On the other hand, more than half of recreational, shopping and
school/church trips are taken in a high occupancy vehicle (Pucher and Renne, 2003). It appears that the
reason why more people do not adopt car sharing is because of the inflexibility of travel, increased travel
time and loss of independence (Huang et al., 2000). It is therefore desirable that more car sharing
incentives are aimed at employers. Air quality regulations in California, enacted in 1988, require employers
to encourage their workers to find alternatives to driving to work alone (e.g. preferential parking areas for
car sharers, financial incentives, guaranteed rides home). After one year the mode share of car sharing
increased by 33 per cent (from 13.8 per cent to 18.4 per cent) and half of participating employers reported
an increase in vehicle occupancy of between zero and 10 per cent (Giuliano et al., 1993).
The main benefits of car sharing come from decreasing fuel savings. Driving with a colleague to work
every day and splitting the fuel bill would almost22 halve one’s fuel bill. Recent calculations suggest that if
a passenger were added to one in ten vehicles in the US, the aggregate fuel consumption would fall by 5.4
per cent (Jacobson and King, 2009). Overall, car sharing can make a small but cost-effective contribution
in reducing traffic levels and pollution (Bonsall, 2002).
Apart from increasing parking charges and road tolls, another incentive to encourage car sharing is the
introduction of HOV lanes on motorways. These lanes only admit vehicles with at least 2 or 3 passengers
and tend to be less congested than other lanes. Although HOV lanes are becoming quite common in the
US, their effects on congestion and pollution are contested and not well understood (Johnston and
Ceerla, 1996; Dahlgren, 1998; Menendez and Daganzo, 2007). The first HOV lanes in the Netherlands,
which opened in 1994, were closed after only a few weeks (Bovy, 2001). Also, despite many successful
HOV lane projects in the US (for example the I-395 in Virginia provides more than half an hour of time
saving during peak hours), HOV lanes have not managed to stop declining vehicle occupancy (Kwon and
Varaiya, 2008). Finally, HOV lanes seem to have a very small effect on CO 2 emissions. In Stockholm for
example, where there are HOV lanes with a minimum occupancy requirement of three people per vehicle,
the annual reduction in CO2 emissions has only been 0.3 per cent (Lindqvist and Tegner, 1998, in Gross
et al., 2009).
9.2 Car clubs
Most cars are unused for 23 hours a day (Shaheen et al., 1998). Car clubs give its members access to a car
without having to bear the cost of buying and maintaining an underutilised vehicle. Car clubs can thus
have a positive social impact by giving access to mobility to lower-income households. A typical car club
pricing scheme makes it worthwhile to substitute away from a personal vehicle if the annual mileage is
less than 6,000-10,000 miles (Shaheen et al., 2006). Annual mileage can be considerably higher, especially
for higher-income groups so car club membership can often act as a supplement to an existing vehicle.
Since 1988 car club membership and fleet has grown dramatically and now there are almost 350,000 club
members and 11,700 vehicles around the world (Shaheen and Cohen, 2007). Most of the growth during
the 1990s was in Europe, especially in Switzerland, Austria, the Netherlands and Germany, but the
phenomenon is spreading quickly to the Americas, Asia and Australia (Shaheen et al., 1998). Some car
clubs are not-for-profit organisations, but recently there has been a growth in commercial enterprises
(Shaheen et al., 1998), some of which, such as the Edinburgh car club, require initial public funding
(Enoch and Taylor, 2006). However, governments have been happy to support car clubs because there is
22 ‘Almost’ because one has to travel an additional distance to pick up passengers and extra passengers increase the weight of the car.
evidence that net economic benefits of car clubs may even be higher than those from major road schemes
(Fellows and Pitfield, 2000).
Car sharing is not a widespread practice so its overall impact on transport, pollution and congestion is
quite small. However, considerable local effects indicate that car sharing can play its part in reducing
emissions. Car club members tend to give up their own cars and use more public transport instead of
private vehicles. Shaheen et al. (2006) report that car club membership reduces total personal vehicle
miles travelled by 44 per cent on average in the US and by between 28 per cent and 45 per cent in
Europe. Steininger et al. (1996) find that total net car mileage of car owners declines by 46.8 per cent
mainly due to a modal switch to public transport. In Europe personal carbon emissions fall between 39
per cent and 54 per cent after joining a car club (Ryden and Morin, 2005, in Shaheen and Cohen, 2007).
Ledbury (2007) estimates that if car clubs succeeded in achieving 15 per cent penetration of the UK
population, they would save 7.75 million tonnes of CO2 (or 6.4 per cent of transport emissions). On the
congestion side, Steininger et al. (1996) argues that because per hour rates make car club cars unattractive
for commuting, rush hour traffic would fall.
Below we discuss two examples of successful car clubs, with a focus on their economic and
environmental benefits. These two car clubs were chosen because they provide at least some solid
empirical evidence of the magnitude of desired effects. There remains much data to be collected and
analysed before robust conclusions can be drawn about the impacts of car clubs.
9.2.1 Car clubs in Austria
Europe was a pioneer of car clubs and in 1996 its German-speaking countries had approximately 20,000
car club members and 1,260 fleet cars. Steininger et al. (1996) carried out a comparative survey of car club
members in Austria. They found that members tend to be more educated than the Austrian average, but
only slightly richer. Car clubs increased the mobility of no-car households by 61 per cent, but reduced the
car-owning households’ total mileage by over 20 per cent, which is in line with previous evaluations.
Interestingly, average vehicle occupancy increased to 1.9, which was 36 per cent above the national
average at the time. The authors estimated that car club membership potential is about 9 per cent of
urban population.
9.2.2 City CarShare in San Francisco, California
City CarShare was established in San Francisco Bay Area in 2001 and operates as a not-for-profit
organisation. The monthly membership fee is $45 (£30, €35) and driving rates are $5 (£3.4, €3.8) per hour
and 40 cents (27 pence, 30 Euro cents) per mile. Cervero and Tsai (2004) provide a comprehensive
evaluation of members’ travel patterns compared to a group of non-members after two years of the
scheme. Their key results are the following:
The club attracted almost 3,000 members.
Car club cars constituted 10 per cent of total vehicle miles travelled for members. Members
walked or cycled 45 per cent of all trips.
Nearly 30 per cent of members got rid of their car and two thirds decided not to buy another car.
Mode adjusted vehicle miles travelled fell by 47 per cent for members, but increased by 73 per
cent for non-members.
Transport related CO2 emissions fell by 0.34 kg for members, but increased by 0.11 kg for nonmembers. City CarShare now deploys several types of hybrid vehicles so this effect is probably
increasing.
The scheme does not appear to be socially inclusive. 90 per cent of members were professionals
and the median income was $57,000 (£39,000, €43000), both of which are above San Francisco’s
averages.
9.3 Concluding remarks
We outlined above that car sharing incentives introduced by governments, such as HOV lanes, have
ambiguous benefits. It is quite unlikely to take up on a wide-scale in developed countries, because of the
inconvenience and inflexibility which it imposes. Although we have very little data on this, we can say that
informal car sharing exists on an important scale in developing countries. Lack of appropriate
telecommunication technologies is hindering the transformation of car sharing into formal car clubs
there. At the moment, car clubs seem to work well in rather affluent and car-rich environments. What
makes car clubs quite special is that they can be run as for-profit social enterprises, which creates
incentives for entrepreneurs to start them. Governments would need to create appropriate regulatory
frameworks and telecommunication infrastructure in order to encourage them, but their success is likely
to depend on the society’s environmental consciousness and its entrepreneurial spirit.
10. Eco-driving and education campaigns
In this section we consider ways in which individuals’ behaviour, in terms of their driving style and car
purchasing decisions, can be influenced so as to reduce CO2 emissions. Thus we will consider both ecodriving campaigns and obligatory labelling in order to determine whether it is possible to induce people to
change their behaviour simply by providing them with the relevant information. Both information
campaigns do not just provide information on how people can reduce their CO 2 emissions, but also
inform people on how they can save money. In both cases, a reduction in CO 2 emissions is due to a
reduction in fuel consumption due to either driving in a more fuel-efficient way, or due to purchasing
vehicles that consume less fuel.
10.1 Eco-Driving
Eco-driving campaigns aim to inform and educate drivers in order to induce them to drive in a fuelefficient and thus economically and ecologically beneficial way. Anable and Bristow (2007) argue that
there are several aspects to eco-driving, which can be summarised as follows:
Driving practice: adopting an efficient driving style by changing gear optimally (between 2,000
and 2,555 revolutions per minute), keeping a safe distance from other vehicles to avoid
unnecessarily sharp breaking and acceleration, and reducing speeds (adhering to speed limits).
Maintaining optimal tyre pressure, reducing drag by closing windows while driving, and limiting
the use of air conditioning.
Anable and Bristow (2007) also note that there is ‘little doubt that driving style impacts on energy
consumption’ (p.105). Ericsson (2001), for instance, investigating the impact of driving patterns on fueluse and exhaust emissions, finds that in addition to driving speed, independent factors relating to
acceleration and power demand and gear-changing behaviour are important in determining emissions and
fuel consumption. For policy this implies an important role for ‘changing environments, drivers and
vehicles in a way that does not promote heavy acceleration, power demand and high engine speeds’
(Ericsson, 2001, p.344). Economic growth, accompanied by an increasing number of cars on the roads
not only of industrialised, but also developing countries, has led to congestion being a problem in cities all
over the world (Saboohi and Farnazeh, 2009). Thus Saboohi and Farnazeh (2009), studying the case of
the Iranian capital Teheran under various degrees of traffic flow intensity, emphasise that optimising
driving behaviour subject to traffic conditions is important for improving the energy intensity of
transport. Studies on the impact of eco-driving campaigns thus tend to differ depending on where the
studies were undertaken and the driving style prior to the campaign. Smokers et al. (2006) note that due
to the multitude of circumstances which may affect the results of the policy, different studies find that
eco-driving could lead to reductions in CO2 emissions of between 5 and 25 per cent, with most
concluding that reductions around 10 per cent are achievable. In addition to reducing CO 2 emissions,
eco-driving, by promoting lower and more constant speeds and greater distances between cars, also has
the benefit of reducing car accidents, noise pollution and wear of car components (Harmsen et al., 2003).
10.1.1 Implementation
Eco-driving has been implemented in complementary ways both through advertising campaigns and
direct education and training of drivers. Advertising and information campaigns aim to inform drivers
and encourage them to adopt a fuel-efficient driving style. Education and training of drivers can be
provided both on a voluntary and on a compulsory basis. In the Netherlands, for instance, efficient
driving techniques were incorporated into driving lessons as part of the Eco-Drive scheme launched in
2001 (Smokers et al., 2006). The application of eco-driving can also be facilitated by in-car devices such as
Gear-Shifting Indicators. Smokers et al. (2006) differentiate between devices providing in-car information,
driving-advice, and driver assistance. In-car information, provided by an on-board fuel consumption
computer, allows the driver to evaluate the impact of his driving style on fuel consumption. This could
help keep a driver who has learned about eco-driving aware of his fuel consumption. In-car driving
assistance on the other hand, such as Continuous Variable Transmission and Automated Manual
Transmissions, effectively overrules the driver, deciding for him how to operate. An intermediate option
between these two is the in-car driving advice, such as a Gear Shifting Indicator, which indicates to the
driver when he should change gear.
10.1.2 Examples of successful implementation
Harmsen et al. (2007) study the impact of the Eco-driving program in the Netherlands between 1999 and
2004 and find that, in that period, the program achieved reductions in fuel consumption of between 0.3
and 0.8 per cent, equivalent to 0.1 to 0.2 million tonne reduction in CO2 emissions.
Harmsen et al. (2007) report that the Dutch Eco-driving program includes five different kinds of
measures:
promoting an energy efficient driving style, both through an extensive campaign including
advertising on television, radio, the internet and leaflets, as well as through subsidised training
courses for groups of (professional) drivers;
teaching eco-driving principles as part of the driving school curriculum, training driving
instructors, and including the principles in the driving theory exam;
stimulating fuel-saving in-car devices, promoted as part of the public campaign and with a tax
exemption from May 2000 to January 2005;
facilitating optimal tyre pressure checks, by organising demonstration and training projects
on how to check tyre pressure. Furthermore extensive information campaigns and targeted
marketing activities (e.g. leaflets to service stations) were set up. The objective is to eventually get
tyre pressure checks integrated in the periodic motor vehicle test;
stimulating purchase of more energy efficient cars, complementing the EU requirements for
labelling of cars, the program also raises awareness through the driving school curriculum,
training courses, and the advertising campaign. However, effects of changes in purchase
behaviour are not attributed to the Eco-driving program in the study undertaken by Harmsen et
al. (2007).
We shall now consider how successful the implementation of these different measures has been.
Harmsen et al. (2007) note that while 76 per cent of driving instructors were trained by 2004, 92 per cent
of these claiming to instruct their pupils on eco-driving, it is uncertain what proportion of new drivers are
acquainted with eco-driving and will correctly apply eco-driving principles in the long term. The training
program for existing drivers only succeeded in reaching 1.5 per cent of the total driver population in the
Netherlands and is thus very limited in its coverage. A telephone survey of 1,100 respondents found a
gradual increase in the numbers of respondents reporting to apply selected eco-driving principles.
Harmsen et al. (2007) thus conclude that the data ‘support the objective of the program to catalyse more
energy-efficient driving behaviour’ (Harmsen et al., 2007, p.1705). The study also notes that it is
recognised that training courses are more effective than just communication and creating awareness are
on their own. Regarding tyre pressures, the study finds that the number of cars with correct tyre pressures
did not increase significantly between 1999 and 2004. The tax exemption scheme, on the other hand is
considered to have been successful, with an increase in the possession of in car-devices in the current car
stock from 13 per cent in 2000 to 33 per cent in 2004, an estimated 45 to 60 per cent of this increase
being attributed to the tax exemption scheme. The costs of the program to the Dutch government are
estimated to be in the range of €9 to €20 per tonne of CO 2 avoided, or between €68 and €99 when
including the costs from the tax exemption scheme. Costs to the end-user, on the other hand, are
negative due to the large savings in fuel and high fuel costs. End-users were thus found to save between
€210 and €418 per avoided tonne of CO2 emissions (Harmsen et al., 2007).
We should note here that implementing eco-driving can also be a successful means of reducing costs for
public transport operators. In Athens, for example, an eco-driving pilot program was undertaken, with
the aim of investigating the effects of changes in urban bus drivers’ driving behaviour as a result of ecodriving training (Zarkadoula et al., 2007). The program reported an overall reduction of 4.35 per cent in
fuel use per km. In addition to reducing greenhouse gas emissions, the study found that the new driving
style would lead to reductions in noise pollution and maintenance costs.
10.1.3 Speed limit enforcement
Given the uncertainty about the long-term effects of eco-driving, as people may forget what they have
learned from the campaign, the campaign could be complemented with speed limit enforcement, which
can also bring about more fuel-efficient driving. In the UK, motorways account for 19 per cent of total
annual road mileage and speeds driven on these are ‘well above the optimum for fuel efficiency’ (Anable
and Bristow, 2007, p.109). In 2008, for example, 49 per cent of cars exceeded the 70 miles per hour speed
limit on motorways, around 15 per cent of these exceeding the limit by more than 10 miles per hour (UK
DfT, 2009d). Enforcing speed limits can have significant effects on both emissions and road safety.
France, for example, enforced strict speed limits on its main motorways in 2004, reducing carbon
emissions by 19 per cent and accidents by 30 per cent (House of Commons Environmental Audit
Committee, 2006).
10.2 Obligatory labelling
Obligatory labelling of cars with information on their fuel-efficiency and CO2 emissions aims to influence
consumers’ purchasing decision towards less polluting vehicles. The policy’s objective is thus to decrease
the total CO2 emissions from transport by increasing the average fuel-efficiency of the car fleet. At the
same time, the measure aims to stimulate demand for more fuel-efficient cars (Smokers et al., 2006).
Labelling new cars with information on their fuel-efficiency and CO2 emissions was made obligatory in all
EU Member States with the adoption of the Directive 1999/94/EC. The directive requires the label,
attached to, or displayed near the vehicle, to include information on both the car’s fuel consumption (in
litres per 100 kilometres) and CO2 emissions (in grams per kilometre). Furthermore, the label informs
consumers that CO2 emissions are the main gas contributing to global warming, as well as informing
them of the availability of a free fuel economy guide and the fact that driving behaviour also influences
fuel-efficiency. Several EU states have exceeded the requirements of the EU Directive by introducing
colour-coded energy rating labels (Smokers et al., 2006).
10.2.1 Evaluation
We will now discuss to what extent fuel efficiency or CO2 labelling of cars can affect consumer choice.
Lundquist Noblet et al. (2006) report the results of a vehicle choice experiment. The study finds that if
consumers are provided with information on greenhouse gas emissions of a vehicle, they will consider the
vehicle’s emissions profile as part of their purchase decision. This implies that eco-labelling has a potential
role in affecting purchasing decisions. Evidence regarding eco-labelling, however, is in favour of
providing information to differentiate between the energy-efficiency of vehicles within a particular class,
as consumers are found to react to eco-labelling at the vehicle level, rather than the vehicle class level
(Lundquist Noblet et al., 2006).
Anable et al. (2006) note that it is difficult to determine the impact of eco-labelling, as these labels tend to
be introduced alongside other measures. It is correspondingly difficult to estimate how cost-effective ecolabelling is in reducing CO2 emissions (Anable and Bristow, 2007). McKinsey & Company report that,
despite a record high in fuel prices observed in many regions in 2008, a vehicle’s monthly fuel cost and
environmental friendliness ranked only 13 th and 15th respectively in a ranking of purchase criteria
importance (McKinsey & Company, 2009, p.19) indicating that ‘we may well not have reached the
economic tipping-point where higher fuel prices provoke a radical change in consumer buying patterns.’
(McKinsey & Company, 2009, p.18)
In the UK the ‘green’ car-labelling scheme introduced in July 2005 to enhance the obligatory fuel
economy label was evaluated in a monitoring study 11 months later. The study conducted by LowCVP
found that only 29/40 per cent (unprompted/prompted) of people recently having purchased or about to
purchase a car were aware of the label (Anable et al., 2006). While awareness of the label is likely to
increase, it is yet unclear whether increasing awareness will lead to more fuel-efficient cars being sold.
Anable et al. (2006) thus conclude that information and awareness campaigns are rarely sufficient to
change behaviour on their own, but note that they can be important when combined with other policy
measures. Providing information and raising awareness can thus ‘reveal the choices open to people and
provide policymakers with some space to implement some policies which may incentivise action more
directly’ (Anable and Bristow, 2007).
10.3 Concluding remarks
While the impact of vehicle labelling programs seems uncertain, the potential impact of eco-driving can
be quantified, and McKinsey & Company (2009) find that, on average, eco-driving can improve a car’s
fuel efficiency by 17 per cent. Implementation of eco-driving programmes on a large scale could thus
reduce global emissions by around 3 per cent. Policies improving traffic flow and driving behaviour are
found to be among the most cost-effective measures for CO2 abatement, yielding ‘a per-tonne benefit to
society that is greater than the average benefit from fuel-efficiency measures’ (McKinsey & Company,
2009, p.11). A further benefit of these policies is that they can be implemented quite easily in the short
term, making them ‘especially attractive for the period from 2010 to 2020’ (McKinsey & Company, 2009,
p.11).
11. Information and advertising for
behavioural change
A number of policy measures have been discussed both in Part I and Part II of this volume. Many
policies designed to move towards a model of sustainable transport for the future essentially do this by
trying to change peoples’ behaviour. Economic policies, such as taxes and subsidies, do this by making
people pay the social cost resulting from their transport choices. In this section we consider how such
behavioural changes can be brought about by some of the soft, or as the UK government refers to them,
“smart” policies: providing people with information and education as well as promoting sustainable
transport through advertising. We aim at unveiling some of the cultural, social and psychological factors
that influence travel behaviour and mode choice and which therefore can also have an impact on
behavioural change. Crucial to this section is the understanding that underlying all policy design is a
picture of human nature, an expectation of how people will react to certain policies when they are
implemented. In designing economic policies a very simple picture tends to be sufficient: in order to
make people reduce a particular behaviour, they must simply be made to pay a higher price for it. This
tends to work very well in general, but there are some puzzles: for instance, people appear to have
preferences for “green products” and the Stern Review (2006) concludes that there is ‘clear evidence of
shift towards environmentally and socially responsible consumption and production’ (p.395). Crucially,
this implies that information, advertising, and education policies can affect the choices people make.
11.1 Information and education
Cairns et al. (2004) estimate scenarios for the potential impact of “smart policies” in the UK. “Smart
policies” are defined by Cairns et al. (2004, p.1) as policies including personalised travel planning, travel
awareness campaigns, public transport information and marketing (policy measures which will be
considered in this section), as well as policies considered in previous sections such as car clubs, sharing
schemes or teleworking. Projecting from 2004, they argue that under a “high-intensity scheme” of such
policies together with supporting conventional economic policies it would be possible to achieve a
nationwide traffic reduction of about 11 per cent by 2020 (a “low-intensity scheme” could achieve 2 to 3
per cent) (Cairns et al., 2004, pp.v-vi). Although as stated in Section 1, those projections were initially
used for transport policy planning by the government, the UK DfT has recently changed their view and
decided to make ‘more realistic but cautious assumptions’ (UK DfT, 2009e, p.25). They now assume
“smart policies” would reduce car-trips and car-km by 7 per cent and 3.7 per cent respectively by 2020
(UK DfT, 2009e, Figure A27, p.103).
In his review, Stern (2006) argues that policies addressing barriers to behavioural change constitute a
critical element of a climate change strategy, as cost-effective mitigation options may not be taken up due
to reasons such as a lack of information and the complexity of available choices as well as upfront costs.
He thus notes that ‘a shared understanding of the nature of climate change and its consequences should
be fostered through evidence, education, persuasion and discussion’ (Stern, 2006, p.308).
Information policies, if well-designed, can then be used to:
inform people about the economic and environmental consequences of their actions and prompt
them to act in a sustainable way, and
stimulate innovation and competition in greener goods and services and facilitate
environmentally friendly investment (by introducing green performance labels, for example).
Beyond this, information policies can also address social norms and private attitudes.
Stern notes that ‘shared social and institutional norms are important determinants of behaviour’ (Stern,
2006, p.381). This is analysed using concepts of “evolutionary” or “procedural” rationality, which, unlike
the narrower concepts of rationality conventionally used in economics, can account for the fact that
peoples’ behaviour is shaped by their habits and the customs and expectations of their society. For policy,
this implies an obstacle in bringing about behavioural change, as, for example, people will not adjust their
behaviour instantaneously in response to economic incentives. However, norms can change over time,
which allows for a role for policy. Thus, governments and the media can play a role in the development
of a shared concept of responsible behaviour.
11.1.1 Travel behaviour under risk and uncertainty
In order to better understand people’s travel choices it is important to understand the concept of
rationality and decision making. Peoples’ choices regarding their travel behaviour often have a priori
unknown consequences, and it is thus unsurprising that there has been ‘increased academic interest in
questions of how travellers handle uncertainty and unreliability in transportation networks’ (Schwanen
and Ettema, 2009, p.511).
For several decades the standard model of Expected Utility Theory (Von Neumann and Morgenstern,
1944) was dominant in decision making under risk and uncertainty, defining rational choice as choosing
the alternative with the greatest expected utility.23 However, ‘a substantial body of evidence shows that
decision makers systematically violate its basic tenets’ (Tversky and Kahneman, 1992, p.297), including,
for instance, influential papers by Allais (1953), Ellsberg (1961), and Kahneman and Tversky (1979).
Tversky and Kahneman (1992, p.298) thus list five major violations of the standard model:
Framing effects: there is evidence that, contrary to the rational theory of choice, preferences
differ depending on how the options are framed (i.e. in terms of gains or losses).
Nonlinear preferences: the expectation principle, according to which the utility of a risky
prospect is linear in the outcome probabilities, was famously challenged by Allais (1953), who
showed that the impact on preferences resulting from a difference in probabilities of 0.99 and
1.00 was greater than from a difference between 0.10 and 0.11.
Source dependence: the source of uncertainty, not just the degree, matters for people’s
willingness to bet on uncertain events.
23 Expected utility is the subjective utility of an outcome, multiplied by the probability of this outcome.
Risk seeking: while people are generally assumed to be risk averse, in certain settings risk-seeking
choices are observed.
Loss aversion: in choices both under risk and under uncertainty, ‘losses loom larger than gains
(Kahneman and Tversky, 1984; Tversky and Kahneman, 1991)’ (Tversky and Kahneman, 1992,
p. 298)
Prospect Theory, and its successor Cumulative Prospect Theory (Tversky and Kahneman, 1992)
accommodate these violations of Expected Utility theory and are starting to be applied in transport
research.24 Schwanen and Ettema (2009), for instance, use cumulative prospect theory in order to analyse
how employed parents deal with unreliable transport networks when collecting their children from
nursery (Schwanen and Ettema, 2009, p.523). Their study indicates violations of the axioms of Expected
Utility Theory, and the authors thus conclude that ‘if travel behaviour researchers wish to better
understand how travellers cope with travel time variability, then they should develop alternatives to
expected utility theory (EUT) as the analytical framework on which empirical work is based’ (Schwanen
and Ettema, 2009, p.523).
11.1.2 Information, attitudes, and behaviour
Most economic policies, relying on “carrot and stick” measures and modelling individuals as having a set
of fixed preferences and valuations, are central to policy-making, but ignore the fact that ‘much of public
policy is actually about changing attitudes’ (Stern, 2006, p.395) - with respect to climate change this
involves both changing peoples’ notions of responsible behaviour as well as promoting their willingness
to cooperate. Regarding transport policy, in particular, policy could play a role in changing peoples’
attitudes. Dargay (2008) notes that economic incentives, such as taxes and subsidies, appear to have to be
very large in order to bring about effects on peoples’ fuel consumption and travel mode choice. Car travel
is thus relatively insensitive to changes in costs, indicating that people perceive car use to be a necessity,
even if this is objectively not the case. Thus, Dargay (2008) concludes that information campaigns raising
peoples’ awareness of travel alternatives and the negative environmental impact of their car use could
change people’s attitudes and improve their awareness of alternative transport options. She cautions,
however, that the question whether this will in fact lead to change in behaviour is debatable.
Regarding this issue, the evidence seems mixed. Parkany et al. (2005), for instance, conclude that their
study, in line with many others in the transport literature, shows that ‘attitudinal data is an important
component in the travel behaviour decision process’ (p.12), recommending that attitudes should be
studied to gain an understanding of the processes and factors that affect people’s choices. On the other
hand, however, Jacometti (2008) shows that knowledge does not always change attitude, and attitude does
not always change behaviour. In other words, she argues, raising awareness and providing information are
unlikely to result in behavioural changes. Although she concludes that local programs may have an
important role to play, she also admits that they are fairly resource intensive (p.67). In the area of
transport, where the required change is so large and at so many levels (technological, cultural,
psychological and ultimately, behavioural), local programs may result in higher costs than benefits.
24 Examples include Avineri and Prashker (2004, 2005), Fuji and Kitamura (2004), Senbil and Kitamura (2004), Jou et al. (20 08), De Palma and
Picard (2005), Schwanen and Ettema (2009).
However, considering attitudes can be important in policy design. Cao et al. (2009) note that in analysing
the impact of land use policy measures it is important to control for potential self selection on the basis of
attitudes, which can play a role in the relationship between the built environment and travel behaviour in
a number of different ways. Attitudes may be antecedent, intervening or irrelevant in this relationship. If
attitudes are “antecedent”, they may be the cause for both people walking more, as well as them choosing
to live in a walkable neighbourhood. Attitudes may be “intervening” in two directions: if walking more
establishes or strengthens a walking preference, which, in turn causes people to live in a walkable
neighbourhood, or, if living in a walkable neighbourhood establishes a walking preference, which then
induces people to walk more. In these potential relationships there is no direct causal link between the
built environment and travel behaviour. A direct causal link exists only if attitudes are secondary or
“irrelevant”, i.e. if choosing to live in a walkable neighbourhood directly causes people to walk more, and
attitudes towards walking have no causal role. Understanding the precise nature of the relationship
between the built environment and travel behaviour is crucial for policymaking: when assessing the
potential impact of land use measures it is important to determine the extent of the causal effect of the
policy measure, which implies making sure that the measured impact is in fact due to the policy, and not
caused by people’s attitudes.
11.1.3 Personalised information and marketing
When trying to bring about change in travel behaviour through information and marketing, there is
evidence indicating that personalised communication measures are more effective in changing peoples’
travel behaviour, especially in breaking habitual car use, than non-personalised mass communications
(Fujii and Gaerling, 2007, p.244). It is thus unsurprising that policymakers have increasingly become
interested in using personalised information and marketing strategies, techniques adopted from
commercial marketing (Cairns et al., 2004). Thus, individuals or households are engaged in one-on-one
dialogue and provided with targeted information to enable them to choose a more sustainable pattern of
transport choices. Personal Travel Planning (PTP) thus aims to overcome peoples’ habitual use of the car
and their psychological barriers to using sustainable transport (UK DfT, 2007d).
Personal transport planning has been employed in many different locations and on many different scales.
Cairns et al. (2004) review the evidence on different programs’ success. The first large-scale PTP project
was undertaken in 2000 in the Australian suburb of South Perth. Amongst the sample of 35,000 people,
the policy was estimated to have brought about a 14 per cent reduction in car driver trips (Cairns et al.,
2004, p.103). Regarding the UK, Cairns et al. (2004) report individualised marketing projects to have
reduced driver car trips by 5 and 10 per cent respectively in different areas of Bristol, and find that a pilot
project in London ‘reduced car driver trips by 11 per cent, with another potentially reducing them by 16
per cent’ (Cairns et al., 2004, p.105). These results are found to be comparable with those reported from
similar projects in Germany. Fujii and Taniguchi (2006) find evidence that such “soft” transport measures
relying on personalised communication are also effective in changing travel behaviour in Japan indicating that the effectiveness of these policies extends beyond “Western” cultures.
The UK DfT also reviews the cost-effectiveness of PTP, noting that cost-benefit analyses typically report
cost-benefit ratios around 1:30 over a 10-year period. PTP programs tend to cost between £20 and £38
per household and become increasingly cost-effective as the scale of the program increases. Thus, for
large-scale UK PTP projects value for money estimates in the first year of implementation are reported as
being between £0.02 and £0.13 per vehicle kilometre saved (UK DfT, 2007d, p.99).
11.1.4 Impacts from information and education
What can we then conclude as being the role for information and education in bringing about behavioural
change with respect to transport choices? The review by Anable et al. (2006) addresses the infamous
attitude-behaviour gap: the question why people’s knowledge and attitudes towards environmental issues
or climate change so often fail to induce people to make changes in their travel behaviour in order to
mitigate its effects. They note that this gap can be considered ‘one of the greatest challenges facing the
public climate change agenda’ (Anable et al., 2006, p.9) - a key issue in bringing about behavioural change.
Their review suggests an emerging consensus on the view that information is necessary but not sufficient
for behavioural change. Thus, measures addressing attitudes and intentions are not likely to be very
effective on their own, but classical economic policies ‘without a targeted strategy of information and
attitude campaigning are also set to be less effective and possibly even counterproductive’ (Anable et al.,
2006, p.19). The optimum solution thus involves successfully combining both types of policies.
Researchers studying transport behaviour have also made use of the psychological “Theory of Planned
Behaviour”, an extension of the theory of reasoned action (Ajzen and Fishbein, 1980, Fishbein and
Ajzen, 1975) to behaviour over which agents have incomplete volitional control. A behaviour is under
incomplete volitional control if a person cannot simply decide at will to perform this behaviour, but also
requires some non-motivational factors, such as opportunities or resources, for example, time, skills,
money, cooperation (Ajzen, 1991, p.182). According to the Theory of Planned Behaviour, it is possible to
accurately predict intentions for different kinds of behaviour from ‘attitudes toward the behavior,
subjective norms, and perceived behavioral control’ (Ajzen, 1991, p.179). An agent’s perception of his
perceived behavioural control together with his intentions then ‘account for considerable variance in
actual behavior’ (Ajzen, 1991, p.179). Figure 4 summarises this process.
Figure 4: The Theory of Planned Behaviour
Source: Ajzen (1991), p.182.
Gardner (2009) notes that the Theory of Planned Behaviour is the most widely used model to analyse the
cognitive determinants of car use (Gardner, 2009, p.68). Studying behaviour of car and bicycle
commuters, Gardner finds that commuters’ mode choice is stable over time and, in line with the Theory
of Planned Behaviour, commuting could be modelled as reasoned action. However, his studies also show
that the effect of intention on behaviour is moderated by habits, such that ‘intention predicted behaviour
where habit was weak, but where self-reported habit was strong, behaviour was determined solely by
habit, and not by intention’ (Gardner, 2009, p.71).
11.2 Advertising and marketing
One of the key tasks in advertising and marketing is market research: knowing the market, how it is
composed, knowing what drives consumers’ decisions therein. Thus, policy-makers aiming to bring about
behavioural change in people’s transport decisions can similarly benefit from an understanding of what
drives behaviour. A key concern in bringing about behavioural change is to encourage people to reduce
their car use. In order to address this problem effectively, an understanding of why people use cars will be
necessary.
Steg (2005) conducted studies in the Netherlands examining peoples’ reasons for using cars. Her results
reveal that car use, in addition to fulfilling instrumental functions, also fulfils important symbolic and
affective functions. Furthermore, she finds that commuters’ car use was ‘most strongly related to
symbolic and affective motives, and not to instrumental motives’ (Steg, 2005, p.147) and differences
between individuals were also greatest in their evaluation of symbolic and affective motives. Regarding
policy-making, Steg (2005) notes that her results suggest that in designing effective policies, policy-makers
should consider the multitude of people’s social and affective motives driving car use in addition to their
instrumental motives. Golob and Henscher (1998) suggest, for instance, that ‘the car as a status symbol
can be countered by public transport as an environmental symbol’ (Golob and Henscher, 1998, p.17). In
addition to marketing public transport as an alternative to the private car, Wright and Egan (2000)
propose that targeted propaganda could also de-market the car as a status symbol. Unlike most public
information campaigns this would focus not on people’s sense of public duty, but rather on their selfimage. Thus, they note that peer group pressure could play an important role in changing attitudes
amongst potential car users in young people. The campaigns should be delivered by non-government
agencies in order to lend them credibility: ‘to avoid the appearance of a sermon, a campaign of this kind
must employ subtlety and wit. A celebrity or public figure can deliver the message and lend credibility to
the exercise’ (Wright and Egan, 2000, p.293).
Kahn (2007) considers differences in consumption patterns between environmentalists and nonenvironmentalists in California, using as a proxy a community’s share of registered Green Party voters.
The study finds that environmentalists are more likely to use public transport, purchase hybrid-vehicles
and consume less fuel than non-environmentalists. Notably, however, there is a “Prius” effect: the Toyota
Prius is preferred by consumers relative to other similarly green vehicles. This suggests that the Prius is an
environmental status symbol as it is widely recognised as the “Green car” due to extensive marketing and
celebrity endorsements. The “social interactions effect”, the benefit that people derive from being seen to
behave in an environmentally friendly way, may thus be more important than the private utility they
receive from their choice (Kahn, 2007, p.143).
In evaluating a policy measure it is also crucial to consider its costs. Regarding marketing costs for citywide bus services, Cairns et al. (2004) find that public sector costs for such measures in the UK are about
2 pence per car kilometre saved. If bus companies’ investment is also taken into account, which may
more than pay for itself in terms of generating additional revenue, this reduces the overall cost per car
kilometre saved. However, they conclude that ‘even without this effect, it appears that once a public
transport service exists, additional money spent upon its promotion represents excellent value per car
kilometre reduced’ (Cairns et al , 2004, p.155).
Crucially, successful marketing policies will address the right people. Anable (2005) argues that marketing
campaigns to encourage people to use alternatives to the car should be focused on and tailored towards
those segments in the population ‘with the greatest potential to increase their frequency of use’ (Anable,
2005, p.75). In order to do this she proposes a segmentation approach similar to that used in
conventional marketing: people should be divided into categories not only on the basis of sociodemographic factors, but also on the basis of a ‘combination of instrumental, situational and
psychological factors affecting travel choices’ (Anable, 2005, p.65), since these will differ distinctly for
different groups of people. She thus determines different categories of people along these dimensions.
“Malcontented Motorists” and “Complacent Car Addicts”, for instance, exhibit similar current travel
behaviour, but have very different environmental attitudes. Using a more sophisticated measure of market
segmentation thus allows Anable (2005) to overcome to some extent the attitude-behaviour gap, finding
that ‘environmental concern combined with a sense of moral obligation has helped to account for some
of the variance in attitudes, intentions and behaviour’ (Anable, 2005, p.74).
11.3 Family life changes
Goodwin (1989) uses panel data in order to investigate the effect of important transitions in people’s lives
on their transport choices, considering changes in people’s life-cycle, employment status, income, and car
ownership. The results from the panel data study give a very different picture of transport behaviour
compared to other studies. Goodwin (1989) also undertakes a cross-section analysis, which comes to
similar conclusions as other studies do, finding that higher incomes seem to lead to increased car
ownership, leaving the public transport market increasingly to consist of those dependent on it, i.e. the
young, the elderly, and the low income group. Cross-section data, however, can only capture statics: it can
only reveal the current situation. Panel data, on the other hand, can reveal how behaviour changes over
time amongst different groups of people. Goodwin (1989) thus finds that when people join the
“dependent” group they do not necessarily fully adopt that group’s transport behaviour. For instance,
when people become unemployed they do not necessarily use public transport to the extent that the
average unemployed person does. On the other hand, changes in income appear to have little effect on
car ownership, at least in the first two years after the change occurs. The panel data study thus leads to
very different conclusions, contradicting two well-established policy expectations:
the expectation that increasing incomes will rapidly lead to increases in car ownership, such that
the market for public transport will collapse, and
the expectation that public transport can safely rely on its group of dependent customers.
Goodwin (2008) sums up the results on family life changes very succinctly:
‘People whose lives are more stable and uneventful tend to respond less to changes in the relative attractiveness of
the current travel choice, whether that change affects their current choice getting worse or an alternative getting
better. People whose lives are being changed by some important event or development, tend to respond more to
whatever changes in relative attractiveness there have been.’ (Goodwin, 2008, p.30).
This has important implications for transport marketing campaigns, indicating that campaigns are most
effectively aimed at people in the process of important transitions in their life, as this is when they are
most likely to respond with behavioural change. For example, campaigns should not target “the retired”,
but rather those “in the process of retiring”.
11.4 Concluding remarks
In this section we have discussed how information, education, and advertising campaigns can bring about
change in people’s travel behaviour. Information and advertising policies are most effective when
carefully targeted, on an individual basis, towards those most likely to change their behaviour. Bringing
about behavioural change through these policy measures thus requires a better understanding of peoples’
transport choices, and we therefore have considered how economic and psychological theories such as
Prospect Theory and the Theory of Planned Behaviour can contribute to transport research. Welldesigned information and advertising campaigns can then be very cost-effective measures for bringing
about behavioural change.
Knowledge policies
12. Research and development of new
technologies in transport
The driving force behind sustainable and low-carbon transport of the future is research and development
(R&D) of new technologies. Transport stands to benefit substantially from the efficiency gains found in
new technologies (Banister, 2008). As global economic and population growth lead to increasing fuel and
travel demand, new technologies will be necessary to improve transport efficiency and contain rising
emissions (Stern, 2006). Energy efficiency will only contribute between 31 per cent and 53 per cent of
CO2 emissions reductions by 2050 (Stern, 2006, p.378). In the transport sector, technological advances
have increased fuel efficiency and reduced emissions of local and regional pollutants, but they have not
fully addressed the problem of decarbonisation - a permanent shift away from fossil fuels. Some
countries, such as Japan, are taking big steps in improving the efficiency of passenger and freight
transport. However, higher fuel efficiency lowers the running costs of vehicles and therefore increases the
demand for transport. Therefore, new technologies will be crucial to creating a low-carbon transport
system without hindering private mobility.
There are a number of promising options, at different stages of maturity. These include vehicles that run
on second generation biofuels25, hybrid internal combustion engines, plug-in hybrid and purely electric
vehicles, powered by either fuel cells or batteries. Unfortunately, as of 2009, they all pose problems of one
sort or another. The synthesis of second generation biofuels26, for example, still needs to be optimised to
be cost-competitive with fossil fuels, while purely electric vehicles need batteries with a higher capacity
before they will be accepted by the market.
12.1 The economics of incentives for R&D
As Paul Romer elegantly summarised in his seminal article, ‘technological change arises in large part
because of intentional actions taken by people who respond to market incentives’ (Romer, 1990, p.S72).
25 These improved biofuels are produced from lingo-cellulosic feedstock i.e. ‘low-cost crop and forest residues, wood process wastes, and the
organic fraction of municipal solid wastes… with no additional land requirements or impact on food and fibre production’ (IEA, 2008).
26 The ‘synthesis’ refers to ‘synthesis gas’ from which synthetic diesel and aviation fuels can form via a thermo -chemical reaction.
An obvious way for a firm to produce new technologies is to invest in R&D. The amount of time, money
and resources that a firm spends on R&D is a cost. In general, a firm would only decide to invest in R&D
if the total future discounted profits were higher than the total costs. Under perfect competition and
information, all new knowledge would eventually become available to other firms, which would compete
in the market, driving price down to marginal cost. Hence firms would only make normal profits from
sales and the firm that undertook the research would make a loss - it might as well not have bothered
spending any resources on R&D.
However, R&D in the commercial sector does take place, which suggests that the reasoning above is too
simple. Where do the incentives come from? First, firms would not invest in any R&D in a perfectly
competitive environment. As we explained above, that would be absurd because the firm would almost
certainly make a loss. A firm must be able to make a profit from the sales of the new good, and therefore
will only invest in R&D if the market for this good is imperfect. For example, there may be few firms in
the market so that even if the new technology is adopted by other firms, the innovating firm can make
sufficient oligopoly profits. Alternatively, the firm may be certain that no one can copy its goods, either
because the technology is too advanced or because it has been granted a patent. In that case the firm will
make monopoly profits in the market (for the duration of the patent) and again will find it worthwhile to
invest.
It is worth noting that both tough competition and monopoly can discourage innovation. A monopolist
has no real incentive to innovate if it knows that the barriers to entry are too high and its dominating
position is not under threat. Innovation will only occur in a market with some degree of competition - by
a monopolist who feels a threat of a new entrant or by a smaller firm that wants to jump ahead of
competition and gain market share (Aghion et al., 2005).
12.1.1 Knowledge from the outside
Once we consider any simple real world example, such as calculus or an internal combustion engine, it
becomes obvious that innovation does not only come from within the firm. It is crucial to understand how
firms are able to use external knowledge to produce new products. First, firms may maintain links with
university departments or sponsor research institutes. Second, firms help finance new small ventures by
buying equity stakes in them (Dushnitsky and Lenox, 2005). Third, firms may pool resources together to
form an R&D cartel. They would exploit positive spillovers from their research to develop a technology,
which they would be able to sell in an oligopolistic market (Kamien et al., 1992).
Whatever the pattern of research, a firm uses and builds on the existing stock of knowledge producing
new technologies in order to lower costs. But this new technology will have a positive spillover on other
firms: they will find it easier to carry out their own research and lower their costs (Bernstein and Nadiri,
1988). Having found out about an original idea, they may work towards building their own technology or
they could wait until the patent expires and then use the technology for free. Eventually, almost any new
knowledge will become available to anyone: ‘knowledge is inherently a public good’ (Jaffe, 1986, p.984).
Yet this pattern of knowledge production creates a fundamental problem. If firms are already engaging in
research, there is an incentive for some firms to avoid investing, wait, and simply free-ride on the
spillovers from the new research. For example, fuel cells may be an excellent alternative to the internal
combustion engine in the future, but they require much more funding committed to their R&D to be a
commercially viable product. But most firms are unwilling to commit to finance a particular development
now because they do not want to be the ones bearing the costs should the technology not be profitable or
not succeed at all. Because so many firms do not contribute, a particular technology today is
underprovided and there is market failure. Viewed as a public goods game, we could say that the firms are
stuck in Pareto-inefficient Nash equilibrium - we are locked into using the internal combustion engine. If
all firms concerned coordinated and committed funds to the technology, they would all end up being
better off. And if we consider the fact that the technology would dramatically reduce CO 2 emissions, we,
as a society, would be better off from the coordination.
12.2 Provision of R&D
The process of R&D can be erratic (Onaka and Peltokorpi, 2006). Some new technologies are
incremental improvements and others are revolutionary. It is not yet clear which type is going to
dominate the transport sector in the future. What is clear is that there are many ideas on the table today,
many of which are not commercially deployed. This is a direct consequence of the public good feature of
knowledge, as we explained above. Below we discuss various ways in which the market failure problem
can be addressed by governments and firms.
12.2.1 Role of government in R&D
‘Substantial evidence has shown that the social rate of return to R&D spending significantly exceeds the private rate of return…,
and conventional wisdom holds that this public-good nature of inventive activity makes private R&D spending lower than the
social optimum and warrants a role for government involvement to increase it’ (Goolsbee, 1998, p.298).
Yet some governments have been very reluctant to adopt this ‘conventional wisdom’. Government
expenditure on R&D as a proportion of GDP (GOVRD) in the OECD countries has declined from 0.34
per cent in 1981 to 0.253 per cent in 2007, whereas the total domestic expenditure on R&D as a
proportion of GDP (GERD) has increased from 1.9 per cent to 2.3 per cent over the same period. Figure
5 shows gross domestic expenditure on R&D as a percentage of GDP in 2006.
Figure 5: Gross domestic expenditure on R&D as percentage of GDP in a selection of countries in 2007
Source: OECD (2009)
The governments of the most developed countries are particularly culpable: in the UK and Ireland the
GOVRD fell threefold; in the US, Canada, France and the Netherlands it fell by between 30 per cent and
40 per cent between 1985 and 2006. Figure 6 shows government expenditure on R&D as a percentage of
GDP for a selection of countries over the period 1985-2006.
In the transport sector, there is very little comparable data for gross expenditure. However, we can
compare government outlays and budget appropriations for R&D in transport, telecoms and other
infrastructure. In 2006 the US ($1.8 billion), Japan ($1.2 billion), Spain ($0.55 billion), and Germany
($0.35 billion)27 dwarfed the spending in other OECD countries in absolute terms. However, when
looking at transport/telecoms R&D spending as a proportion of their GDP (GOVTRRD), the
conclusions are different. Japan’s GOVTRRD was at least twice as large as in Germany or in the US, and
five times greater than in the UK (it is not clear how much of it was transport and telecoms). Figure 7
shows government budget appropriations or outlays for R&D for transport, telecoms and other
infrastructure for a selection of countries and for the rest of the OECD for the year 2006.
27 The average exchange rate in the period Jan-Dec 2006 was $1=£0.544=€0.796 (IMF Exchange Rate Query Tool).
Figure 6: Government expenditure on R&D as a percentage of GDP for a selection of countries over
the period 1985-2006
Source: OECD (2008)
Figure 7: Government budget appropriations or outlays for R&D for transport, telecoms and other
infrastructure for the US, Japan, Germany, Spain and the rest of the OECD for the year 2006
Source: OECD (2008)
It is clear from Figures 10 and 11 that governments are not providing enough incentives for firms to
develop new low-carbon transport technologies. Stern (2006, p.347) argues that ‘deployment incentives
for low-emission technologies should increase two to five times globally’ and that ‘global public energy
R&D funding should double’. Funding for transport technologies should rise in line with this, and
governments have a variety of options.
12.2.2 Infrastructure
Lack of appropriate infrastructure hinders the development of many new technologies in transport. For
example, fuel-cell vehicles require an extensive network of refuelling facilities if they are to become
widespread (Ogden et al., 1999). The government is expected to finance such public infrastructure
projects. But many governments are reluctant to invest in new infrastructure because they fear that
another technology may make the infrastructure obsolete. In this case the government may want to share
its own risk by entering into a public-private partnership with a firm. Examples of this type of
arrangement include the European Commission signalling its intention to support fuel cells by offering to
match €470 million in funding for joint technology initiatives with the industry, and the US government
entering into a Partnership for a New Generation of Vehicles with DaimlerChrysler, Ford and General
Motors to improve fuel efficiency of their cars in 1993 (Chalk et al., 2000).
12.2.3 Subsidies and publicly funded R&D
The government could subsidise research, which is already carried out by a firm, by reducing the costs of
production factors or giving it tax breaks. By providing a subsidy to develop a new technology, the
government gives a firm a greater incentive to pursue an R&D project because the firm’s expected loss
from the project would be lower. Alternatively, the government could increase its spending on R&D in
universities and research institutes. As we explain above, the positive spillovers from such spending may
be significant and some studies indicate that the social rate of return of direct R&D spending is higher
than that of infrastructure (Nadiri and Mamuneas, 1994). But again there is an important informational
issue. The government has less information about how successful a technology will be than the researcher
and additionally cannot usually monitor the effort that the researcher will put in. Once again, the
government will be reluctant to subside. In OECD countries, governments fund only 6.7 per cent of
business enterprise expenditure on R&D, although the figure is over 10 per cent in Poland, the Czech
Republic, France and Slovakia.
12.2.4 Direct government spending
Alternatively, the government can guarantee to buy a certain quantity of a new product at a given price or
at a price determined at an auctioned contract. The firm is then guaranteed a revenue stream and can
design its research spending accordingly. However, this strategy is not optimal for a number of reasons.
First, the government would only support the production of a known technology as opposed to
encouraging research into new ones. Secondly, guaranteed purchases stifle competition and encourage
inefficiency and waste.
12.2.5 R&D spending by firms
As it can be seen from Figure 8, the bulk of R&D spending in most countries is done by business
enterprises. Therefore we now focus our attention on the R&D spending on transport which is being
done by firms. In 2008 Toyota spent ¥958.8 billion (€6.31 billion, £5.03 billion, $9.26 billion), Audi,
€2,161 million (£1,722 million, $3,170 million) and the Fiat Group, €1,986 million (£1,583 million, $2,913
million)28 on R&D (Toyota, 2009, p.22; Audi, 2008, p.134; Fiat, 2009, p.11), and each company dwarfs
even the amount the US government, the OECD leader, has contributed to transport and telecoms R&D.
But these vast amounts do not reveal an underlying problem. The transport industry is investing
simultaneously in many low-carbon initiatives of the future. Different companies are making bigger bets
on various technologies, which only reveal their success over time - consider only Toyota’s success with
hybrids (Onaka and Peltokorpi, 2006 offer an interesting discussion) and General Motors’ disaster with
sport utility vehicles.29 Firms cannot observe what others are doing - most R&D programs are kept secret
- so other firms must accept a new technology on the market as a fait accompli. That is not to say that
firms do not share technology: many Volkwagen Group cars (Audi, VW, Seat, Škoda) share its latest
platform. Yet firms are reluctant to share secrets, because a successful and surprising technology will
allow them to quickly capture a larger share of the market in the future.
Part of the success of these technologies comes from the political decisions made at a country and
international scale. However, most governments are unable to develop a comprehensive low-carbon road
map, which will set out the standards and regulations for emissions in the future. Furthermore,
governments cannot commit to a specific technology. The UK government has a policy of “technology
neutrality”, which means that it would not prescribe or predict technology options for the private sector.
Firms which are uncertain about their prospects in the future will choose to under-invest (Klibanoff et al.,
2005) and will also choose to spread their investment thinly amongst various technologies.
28 The average exchange rate in the period Jan-Dec 2008 was £1 = ¥190.5 = $1.84 = €1.25 (IMF Exchange Rate Query Tool).
29 Like in Part I of this volume, sport utility vehicles are defined as 4-wheel vehicles, designed for off-road operation.
Figure 8: Source of R&D expenditures as proportion of GDP
Source: OECD (2008)
12.3 Concluding remarks
Individual governments must make permanent and credible commitments about the regulatory, economic
and technological decision frameworks in order to send a clear signal to the transport industry. These
decisions must be made within the structure of global governance. The transport industry will react by
channelling its R&D towards the most desirable technologies to deliver low-carbon vehicles, which will
meet the standards set out by governments. In order to adopt low-carbon technologies widely in the
transport as well as in other sectors, it is important to create ‘a stable environment for investments and
research and development’ (Van Dender, 2009, p.3862). Only thus will the transport industry be able to
meet the challenge.
13. Transport policies in combination
Road transport externalities are many and varied and, from an economic point of view, they require
specific policies to internalise them. For example, while fuel duties are effective in reducing fuel
consumption and CO2 emissions, they are unsuccessful in reducing congestion. Similarly, a congestion
charge is effective in reducing traffic at peak times but not necessarily fuel consumption and CO2
emissions. Having said that, fuel duties may have little impact on congestion and delays as demand for
travel decreases, and a congestion charge may have a small impact on CO 2 emissions as traffic levels are
reduced during peak times. Similarly, safe cycle paths may induce trip makers to leave the car at home for
short trips, especially if there are high fuel duties and a congestion charge is in operation. If the distance
to local facilities, such as schools, libraries, supermarkets and health services is short enough to be walked
or cycled, this will act as an extra incentive not to use the car.
A policy intended to achieve an objective may thus have unintended side-effects and help (or jeopardise)
the achievement of other objectives. This feature may be used by policymakers at the time of designing
policy packages.
In this section we discuss this potential policy complementarity and interaction, the evidence for it, and
the results of recent research in this area.
13.1 Evidence of positive side-effects of transport policies
There are numerous examples of transport policies which produced desirable side-effects in addition to
delivering their expected impacts. The London Congestion Charging Scheme 30, introduced in February
2003, for instance, is an important example. It had no environmental objectives whatsoever, and its only
aim was to reduce traffic levels and congestion. The scheme succeeded in doing so, and at the same time,
by reducing the number of vehicles in central London and increasing average speeds (with less stop-andgo conditions), reduced emissions of nitrogen oxides by 8 per cent, emissions of particulate matter by 7
per cent, and emissions of carbon dioxide by 16 per cent inside the charging zone (TfL, 2007, p.56).
Another positive side-effect of the London Congestion Charging Scheme was the reduction in the
number of accidents. Although the number of accidents had been decreasing for many years, mainly due
to road safety initiatives, this trend was improved by an estimated further decrease of roughly 40 to 70
accidents per year inside the charging zone and on the Inner Ring Road, which marks the limit to the
zone (TfL, 2007, p.53, p.62).
Implementing congestion charging schemes such as this one could have similar positive effects in other
towns. Santos (2004) optimises and simulates congestion cordon tolls for eight English towns with the
30 The London Congestion Charging Scheme is discussed in Section 5 of Part I of this volume.
aim of reducing congestion and finds that in all cases there would also be positive environmental benefits,
at least for the major health and global warming impacts.
Policies promoting walking and cycling are also beneficial both from an environmental and a health
perspective. Increased walking and cycling reduce rates of coronary heart disease (Hu et al., 2007), type-2
diabetes (Hu et al., 2003), cancer (Cavill et al., 2007), and obesity, (Ogilvie et al., 2004; Matthews et al.,
2007; Bauman and Rissel, 2009). They can thus be encouraged by governments as health policies, as well
as transport policies to reduce CO2 emissions.
13.2 Policy combination and integration
Integrated transport policies were discussed in Section 2.1. Although integration has a range of meanings,
the bottom line is that integration requires coordination or coherence, or at least no contradiction. This
applies to policy objectives across different government departments, social sectors and modes of
transport. A closely related issue is that of policy combination. To control the excessive production of
negative externalities in the road transport sector, a combination of policies (two or more) may be used
instead of just one.
May et al. (2006, p.321) identify four ways in which policies can combine with each other:
complementarity: the use of two instruments has greater impacts than the use of either alone;
additivity: the benefit from the use of two or more instruments is equal to the sum of the
benefits of using each in isolation;
synergy: the simultaneous use of two or more instruments yields higher benefits than the sum of
the benefits of using either one of them alone;31 and
substitutability: the use of one instrument completely eliminates any benefits from using
another instrument.
Taking these interactions into account at the time of designing a policy package will ensure that the
expected results are achieved.
Hickman and Banister (2007, p.382) argue that combinations of policies are required to significantly
reduce CO2 emissions, as individual policies are insufficient. For example, low emission vehicles require
behavioural change, which can be triggered by incentives to influence consumer preferences towards
alternative fuel vehicles. Other examples include the introduction of park-and-ride facilities to enhance a
new rail or bus service; traffic calming measures to enhance the benefits of a bypass; the improvement of
public transport and dedicated cycle lanes to enhance the effects from congestion charging, etc. (May et
al., 2006, p.320).
Policy integration is also useful in overcoming any potential barriers for implementation, which are
usually linked to financial, public acceptability and equity issues (May et al., 2006, p.320). By integrating
policies, financially unviable instruments that did not enjoy public support may become viable or more
acceptable. Congestion charging revenues, for example, can be used for funding the enhancement of
31 Additivity and synergy can be considered as two special cases of complementarity (May et al., 2006, p.321).
pedestrian areas and public transport, thus providing a source of revenue and increasing public
acceptability at the same time.32 Furthermore, integration can combine policies that compensate those
who end up worse-off as a result of the introduction of any particular instrument. For instance, free
public transport passes may compensate low-income groups affected by the congestion charge.
Eriksson et al. (2008) find that combining policies is very important for increasing public acceptability,
especially when push measures (aimed at making car use less attractive by, for example, raising taxes or
charges) and pull measures (aimed at improving alternative options by for example, improving public
transport) are implemented in the same policy package. They also argue that even in those cases public
acceptability may remain low and then an even softer type of policy may be used in combination, such as
an education campaign to increase awareness of the problem.
13.3 Potential synergies
Synergy in the context of policy combination can be defined as the interaction of two or more policies so
that their combined effect is greater than the sum of their individual effects. The pursuit of synergy can
be an objective in itself for the regulator. May et al. (2006, p.320) argue that the planner may be interested
in finding groups of policy instruments ‘which reinforce one another in achieving changes in the transport
system, such as modal shares, or improvements against strategy objectives such as efficiency or
environmental protection’.
There is more evidence of complementarity than of synergy. May et al. (2006, p.321) point out that an
increase in frequency combined with a fare reduction in public transport is likely to increase patronage.
However, this increase in patronage from the two policies combined is unlikely to be greater than the sum
of their individual impacts, which would have indicated the presence of synergy, and it is even likely to be
less than the sum of their individual impacts, which would have indicated additivity.
Nevertheless, there is some research which has found evidence of synergies. Lautso et al. (2004) test
policy combinations consisting of push and pull measures. Policy combinations tested include
combinations of increasing car operating costs by 75 per cent and decreasing public transport fares by 50
per cent, supported by public transport oriented land use policies, and in some cases also increasing
public transport speeds and frequencies. They conduct simulations for a number of European cities
(Helsinki, Dortmund, Naples, Vicenza, Inverness, Bilbao and Brussels) and find clear synergy effects of
combining car pricing policies and public transport policies (p.266), with the potential of radically
improving the environmental, social and economic qualities of the transport and land use system (p.193).
32 Surveys carried out in London between March and August 1999 found that people changed their attitude towards the idea of congest ion
charging when they were told that revenues would be earmarked to transport. 67 per cent of the general public thought that congestion charging
in central London would be a good idea if net revenues were spent on transport improvements, and the proportion increased to 73 per cent
when the respondents’ spending preferences were introduced (ROCOL, 2000, p.57).
13.4 Concluding remarks
Although policy combination can serve as a useful tool in integrating different objectives into one policy
package and can also help to overcome implementation barriers, there is no solid evidence of synergy as a
result.
The evidence of positive side-effects of many transport policies, however, suggests that integrating
objectives and combining policies can increase the chances of achieving the desired objectives. Although
there is a lack of research that quantitatively measures and predicts side-effects, these seem to be positive,
thus pointing towards the design of policy packages rather than individual policies.
14. Conclusions and policy
recommendations
In Part II we have considered a number of different policies and their role in making road transport more
sustainable. The success of these transport policies will depend heavily on the context of their
implementation. As so often with policies, there is no simple “one-size-fits-all” solution. However, there
is plenty of scope for implementing policy packages, combining various policies in the most appropriate
context.
Rural and urban areas in developing and developed countries face a host of barriers to creating a
sustainable mobility form. These barriers may be physical, such as inadequate public transport and
infrastructure or low population densities, which are entrenching car dependency, as well as behavioural,
for instance the social status associated with car-ownership. Combining physical and soft policies, in the
form of new integrated transport infrastructure, appropriate land use, and information provision to the
public may help to overcome these barriers. Economic incentives and government support can accelerate
the development of new transport technologies. Physical and soft policies, which are very cost-efficient in
reducing carbon emissions, can thus serve as a useful complement to economic policies.
We thus offer the following context-specific policy recommendations.
14.1 Urban transport in developed countries
Integrated transport policy is key to moving towards a more sustainable design of urban mobility.
Providing safe and pleasant interchange facilities together with integrated ticketing and real-time
passenger information can help make public transport more attractive and reduce some of its perceived
disadvantages relative to the car. In order to meet urban mobility needs, a sustainable urban mobility
concept must be multi-modal, integrating different modes of public transport, private cars, and walking
and cycling. For example, building cycling lanes to railway stations encourages people to make multimodal commutes. Park-and-ride facilities can be effective at reducing congestion and pollution in the city
centre. Mixed-use neighbourhood design can reduce travel demand by locating facilities near people’s
homes.
Car use in the city can be further discouraged by parking restrictions and establishing car clubs, together
with congestion charges. Combining these policies with information and advertising campaigns that
promote more sustainable transport choices can help to bring about behavioural change and discourage
unnecessary car use. Changing driving behaviour by informing people about eco-driving can also reduce
CO2 emissions in a very cost-effective way.
Commuting traffic is central to the urban mobility challenge, and thus teleworking could play a role in
alleviating congestion. Establishing satellite offices, in particular, could be feasible for companies
operating in very congested cities. Cities also offer an excellent testing ground for innovative transport
technologies, such as fuel cell buses.
14.2 Rural transport in developed countries
Meeting the transport needs of rural populations in a sustainable way faces the challenge of low
population densities, which makes public transport provision less feasible. Moving towards more
demand-based forms of public transport could help to ensure accessibility and combat social exclusion.
Promoting walking and cycling can help break the habit of taking the car for short-distance journeys in
small towns. Facilities, similar to those we suggested for cities, as well as pedestrianisation of streets,
could serve well for that purpose. Teleworking may also reduce the need for commuting to the city to
some extent.
14.3 Urban transport in developing countries
Cities in developing countries face the particular problem of rapid urbanisation and motorisation, which
cause and exacerbate the interlinked problems of congestion, pollution, safety issues, and social exclusion.
Policy recommendations must be context specific as there is no simple model to fit all cities. However,
the following policy measures may undoubtedly play a role in moving towards a more sustainable model
of urban transport.
Combining land use and public transport policy can help to direct growth towards a more sustainable
urban form that can be served effectively by public transport services. The example of Curitiba
demonstrates the success of integrated land use and transport policies, and also emphasises that
establishing a transport network need not necessarily involve unfeasibly large capital expenditure. Simple
measures, such as establishing bus priority lanes, for instance, can be extremely cost effective. Integrated
ticketing (ensuring that interchanges are not excessively costly), as well as integrating public transport
facilities with other modes of transport are also key to developing a sustainable transport network. If
increases in incomes are to be disconnected from increasing motorisation, public transport services need
to be both affordable and desirable.
Walking and cycling can play a key role in urban transport, especially for short distances. Improving the
infrastructure for walking and cycling and enforcing the rights of these so-called “vulnerable” road users
can help to make these modes safer and more attractive. Crucially, rising to the challenge of developing a
sustainable transport network requires both political will and institutional capability.
14.4 Rural transport in developing countries
Rural areas of developing countries tend to be extremely inaccessible by transport. This is mainly due to
the lack of paved roads, which are necessary for more efficient transport. Therefore, in order to promote
sustainable forms of transport, other than walking, governments must invest extensively into new roads
and related infrastructure. This may have significant social benefits, as people find access to emergency
healthcare, education, and labour opportunities. On top of that, new roads will drastically reduce
transport costs and promote trade, particularly in agricultural products, between rural and urban areas.
However, this policy recommendation, which stands in stark contrast to others because of its context, will
not be at all sufficient to encourage sustainable transport in the future. Informal car sharing, which
probably exists on a vast scale in the rural areas of developing countries, has the potential of turning into
permanent, formal car clubs. Similar schemes, such as the boda boda in Uganda, already exist and continue
to thrive. Governments may also want to exploit the social capital of closely-knit communities in villages
and promote credit facilities for communal vehicles.
14.5 Final remarks
Policymakers must approach the challenge of creating a sustainable mobility model for the future with a
trinity of transport policies. Economic policies offer strong financial incentives for individuals to shift
into low-carbon transport modes and for firms to invest in energy-efficient transport technologies.
Physical policies provide feasible and sustainable transport alternatives. Finally, soft policies inform
people about the consequences of their transport choices, and induce them to take up more sustainable
options.
Acknowledgements
We are grateful to Jack Jacometti, Stewart Kempsell and Sylvia Williams, from Shell International, as well
as Stephen Skippon, from Shell Global Solutions, for fruitful discussions about the work presented in this
paper.
We are also thankful to all our colleagues at the Smith School of Enterprise and the Environment, and
especially to Oliver Inderwildi, Laura Maconi, Tara Shirvani, Xiaoyu Yan, Aaron Holdway, Chris Carey
and Nick Owen, who also worked on the Future of Mobility, and to David Metz, from University College
London, Phil Goodwin, from University of West England, and Tim Jones, from Oxford University, for
helpful pointers.
Finally, we are indebted to our external reviewer, Moshe Givoni, from the Transport Studies Unit at
Oxford University, for helpful comments and suggestions that improved this paper.
Any remaining errors or shortcomings are our own. Any views or conclusions expressed in this paper do
not represent those of Shell, the Smith School of Enterprise and the Environment or Oxford University.
References
Abrate, G., Piacenza, M. and D. Vannoni (2009), ‘The impact of Integrated Tariff Systems on public
transport demand: Evidence from Italy’, Regional Science and Urban Economics, Vol. 39, No. 2, pp.120–127.
ADONIS (1999), Best Practice to Promote Cycling and Walking and How to Substitute Short Car Trips by Cycling
and Walking, ADONIS Transport Program, European Union,
http://cordis.europa.eu/transport/src/adonisrep.htm.
Affuso, L., Masson, J. and D. M.G. Newbery (2003), ‘Comparing investments in new transport
infrastructure: Roads vs railways?’, Fiscal Studies, Vol. 24, No. 3, pp. 275-315.
Aghion, P., Bloom, N., Blundell, R., Griffith, T. and P. Howitt (2005), ‘Competition and Innovation: An
Inverted-U Relationship’, Quarterly Journal of Economics, Vol. 120, No. 2, pp. 701-728.
Ajzen, I. (1991), ‘The Theory of Planned Behaviour’, Organizational Behaviour and Human Decision Processes,
Vol. 50, No. 2, pp. 179-211.
Ajzen, I. and M. Fishbein (1980), Understanding attitudes and predicting social behavior. Englewood Cliffs, NJ:
Prentice.Hall.
Allais, M. (1953), ‘Le comportement de l’homme rationnel devant le risqué: Critique des postulats et
axiomes de l’Ecole américaine’, Econometrica, Vol. 21, No. 4, pp. 503-546.
Amt für Bürgerservice und Informationsverarbeitung Freiburg (2007a), Straßen, Radwege und Parkplätze,
http://fritz.freiburg.de/scripts/fritz/fritzview.exe?aw=Verkehr/Gesamtstadt%20Verkehr%20Strassen%20Radwege%20Parkplaetze
Amt für Bürgerservice und Informationsverarbeitung Freiburg (2007b), Freiburger Verkehrs AG,
http://fritz.freiburg.de/scripts/fritz/fritzview.exe?aw=Verkehr/Gesamtstadt%20Verkehr%20FreiburgerVAG
Amt für Bürgerservice und Informationsverarbeitung Freiburg (2008), Bevölkerung seit 1950 (amtliche
Einwohnerzahl), http://fritz.freiburg.de/scripts/fritz/fritzview.exe?aw=Bevoelkerung/Gesamtstadt%20Bev.%20seit%201950
Anable, J. (2005), ‘“Complacent Car Addicts” or “Aspiring Environmentalists”? Identifying travel
behaviour segments using attitude theory’, Transport Policy, Vol. 12, No. 1, pp. 65–78.
Anable, J. and A. L. Bristow (2007), ‘Transport and Climate Change: Supporting document to the CfIT
report’, Report prepared for the Climate Change Working Group of the Commission for Integrated
Transport, http://www.cfit.gov.uk/docs/2007/climatechange/pdf/2007climatechange-support.pdf.
Anable, J, Lane, B. and T. Kelay (2006), Review of public attitudes to climate change and transport: Summary report
for the UK Department for Transport, July.
http://www.dft.gov.uk/adobepdf/163944/A_review_of_public_attitude1.pdf
Andersen, L. B., Schnohr, P., Schroll, M. and H. O. Hein (2000), ‘All-Cause Mortality Associated With
Physical Activity During Leisure Time, Work, Sports, and Cycling to Work’, Archives of Internal Medicine,
Vol. 160, No. 11, pp. 1621-1628.
Anderson, R. (2003), A Study into the Tools for Influencing Consumer Behaviour in Transport Choices, AEAT,
ED01512.
André, M. and U. Hammarström (2000), ‘Driving speeds in Europe for pollutant emissions estimation’,
Transportation Research Part D: Transport and Environment, Vol. 5, No. 5, pp. 321-335.
Audi (2008), Audi: 2008 Annual Report, Audi AG, Ingostadt, Germany.
Avineri, E. and J. N. Prashker (2004), ‘Violations of expected utility theory in route-choice stated
preferences: the certainty effect and inflating of small probabilities’, Transportation Research Record, No.
1894, pp. 222–229.
Avineri, E. and J. N. Prashker (2005), ‘Sensitivity to travel time variability: travelers’ learning perspective’,
Transportation Research Part C: Emerging Technologies, Vol. 13, No. 2, pp. 157–183.
Bailey, D. E. and N. B. Kurland (2002), ‘A Review of Telework Research: Findings, New Directions, and
Lessons for the Study of Modern Work’, Journal of Organizational Behavior, Vol. 23, No. 4, pp. 383-400.
Banister, D. (2005), Unsustainable Transport: City Transport in the 21st Century, London: Routledge.
Banister, D. (2008), ‘The sustainable mobility paradigm’, Transport Policy, Vol. 15, No. 2, pp. 73-80.
Banister, D. and D. Stead (2004), ‘Impact of information and communications technology on transport’,
Transport Reviews, Vol. 24, No. 5, pp. 611-632.
Banister, D. and R. Hickman (2006), ‘How to design a more sustainable and fairer built environment:
transport and communications’, IEEE Proceedings of the Intelligent Transport System, Vol. 153, No. 4, pp. 276291.
Barker, K. (2006), Barker Review of Land Use Planning: Final Report – Recommendations, December.
http://webarchive.nationalarchives.gov.uk/+/http://www.hmtreasury.gov.uk/d/barker_finalreport051206.pdf
Barter, P. A. (2000), ‘Urban Transport in Asia: Problems and Prospects for High-Density Cities’, AsiaPacific Development Monitor, Vol. 2, No. 1, pp. 33-66.
Bassett, D. R. Jr., Pucher, J. Buehler, R., Thompson, D. L. and S. E. Crouter (2008), ‘Walking, cycling,
and obesity rates in Europe, North America, and Australia’. Journal of Physical Activity and Health, Vol. 5,
No. 6, pp. 795-814.
Bauman, A. E. and C. Rissel (2009), ‘Cycling and health: an opportunity for positive change?’, Medical
Journal of Australia, Vol. 190, No. 7, pp. 347-348.
Bélanger, F. (1999), ‘Workers' propensity to telecommute: An empirical study’, Information & Management,
Vol. 35, No. 3, pp. 139-153.
Bélanger, F. and R. W. Collins (1998), ‘Distributed Work Arrangements: A Research Framework’,
Information Society, Vol. 14, No. 2, pp. 137-152.
Bernstein, J. I. and M. I. Nadiri (1988), ‘Interindustry R&D Spillovers, Rates of Return, and Production in
High-Tech Industries’, American Economic Review Papers and Proceedings, Vol. 78, No. 2, pp. 429-434.
Bolund, P. and S. Hunhammar (1999), ‘Ecosystem services in urban areas’, Ecological Economics, Vol. 29,
No. 2, pp.293-301.
Bonilha Institute (1992), Pesquisa por Amostragem do Transporte Publico (Public Transport Sample Survey),
Curitiba, Brazil.
Bonsall, P. (2002), Car Share and Car Clubs: potential impacts, final report for DTLR and the Motorists
Forum, February.
Bovy, P. H. L. (2001), ‘Traffic flooding the low countries: how the Dutch cope with motorway
congestion’, Transport Reviews, Vol. 21, No. 1, pp. 89-116.
Budd, T. (2009), Public experiences of home working and internet shopping, UK Department for Transport,
January.
http://www.dft.gov.uk/pgr/statistics/datatablespublications/trsnstatsatt/homeworkinginternet
Buys, P., Deichmann, U. and D. Wheeler (2006), Road Network Upgrading and
Overland Trade Expansion in Sub-Saharan Africa, Working Paper 4097, World Bank Policy Research, World
Bank Development Research Group, December.
Cairns, S., Sloman, L., Newson, C., Anable, J., Kirkbride, A. and P. Goodwin (2004), Smarter Choices:
Changing the Way We Travel, Final report to the UK Department for Transport, London.
http://www.dft.gov.uk/pgr/sustainable/smarterchoices/ctwwt/
Cairns, S., Sloman, L., Newson, C., Anable, J., Kirkbride, A. and P. Goodwin (2008), ‘Smarter Choices:
Assessing the Potential to Achieve Traffic Reduction Using Soft Measures’, Transport Reviews, Vol. 28, No.
5, pp. 593-618.
Cameron, M. H., Vulcan, A. P., Finch, C. F. And S. V. Newstead (1994), ‘Mandatory Bicycle Helmet Use
Following a Decade of Helmet Promotion in Victoria, Australia – An Evaluation’, Accident Analysis and
Prevention, Vol. 26, No. 3, pp. 325-337.
Cao, X.(J.), Mokhtarian, P. L. and S. L. Handy (2009), ‘Examining the Impacts of Residential SelfSelection on Travel Behaviour: A Focus on Empirical Findings’, Transport Reviews, Vol. 29, No. 3, pp. 359395.
Caspersen, O. H., Konijnendijk, C. C. and A. S. Olafsson (2006), ‘Green space planning and land use: An
assessment of urban regional and green structure planning in Greater Copenhagen’, Geografisk Tidsskrift,
Danish Journal of Geography, Vol. 106, No. 2, pp. 7-20.
Cavill, N., Kahlmeier, S., Rutter, H., Racioppi, F. and P. Oja (2007), Economic Assessment Of Transport
Infrastructure And Policies Methodological Guidance On The Economic Appraisal Of Health Effects Related To
Walking And Cycling, World Health Organization, Regional Office for Europe, Copenhagen.
Cavill, N., Kahlmeier, S., Rutter, H., Racioppi, F. and P. Oja (2008), ‘Economic analyses of transport
infrastructure and policies including health effects related to cycling and walking: A systematic review’,
Transport Policy, Vol. 15, No. 5, pp. 291-304.
Cebollada, A. (2009), ‘Mobility and labour market exclusion in the Barcelona Metropolitan Region’,
Journal of Transport Geography, Vol. 17, No. 3, pp.226-233.
Cervero, R. (2004), Balanced Transport and Sustainable Urbanism: Enhancing Mobility and Accessibility through
Institutional, Demand Management, and Land-Use Initiatives, Paper prepared for International Symposium on
Urban Mobilities: The Challenges, the Research Issues in China and Abroad Tsinghua University, Institut
pour la ville en movement, October.
Cervero, R. and K. Kockelman (1997), ‘Travel Demand and the 3Ds: Density, Diversity, and Design’,
Transportation Research Part D: Transport and Environment, Vol. 2, No. 3, pp.199-209.
Cervero, R. and M. Hansen (2002), ‘Induced travel demand and induced road investment - A
simultaneous equation analysis’, Journal of Transport Economics and Policy, Vol. 36, September, pp. 469-490.
Cervero, R. and Y.-H. Tsai (2003), San Francisco City Car Share: Travel-Demand Trends and Second-Year Impacts,
Working Paper WP-2003-05, IURD Working Paper Series, Institute of Urban & Regional Development,
August.
http://knowledge.fhwa.dot.gov/cops/hcx.nsf/0/29ab105a2787964c85256db100641efe/$FILE/San%20
Francisco%20City%20Carshare%202nd%20year%20-%20July2003.pdf
Chalk, S. G., Miller, J. F. and F. W. Wagner (2000), ‘Challenges for fuel cells in transport applications’,
Journal of Power Sources, Vol. 86, No. 1-2, pp. 40-51.
Chester, M. V. and A. Horvath (2009), ‘Environmental Assessment of Passenger
Transportation Should Include Infrastructure and Supply Chains’, Environmental Research Letters, Vol. 4,
No. 2, pp. 1-8.
Choo, S., Mokhtarian, P. L. and I. Salomon (2005), ‘Does telecommuting reduce vehicle-miles traveled?
An aggregate time series analysis for the U.S. ’, Transportation, Vol. 32, No. 1, pp. 37-64.
City of Portland Office of Transportation (2004), Annual Report 2003-2004, Portland, Oregon, September.
Cohen, H. (1995), ‘Review of empirical studies of induced traffic’, in Transportation Research Board,
Expanding Metropolitan Highways: Implications for Air Quality and Energy Use, Special Report No. 345,
Washington DC: National Academy Press, Appendix B, pp. 295-309.
http://www.nap.edu/catalog/9676.html
Coombe, D. (1996), ‘Induced traffic?’, Transportation, Vol. 23, No. 1, pp. 1-3.
Copenhagen City (2006), Bicycle Account – 2006,
http://www.vejpark2.kk.dk/publikationer/pdf/464_Cykelregnskab_UK.%202006.pdf
Crane, R., ‘The Influence of Urban Form on Travel: An Interpretive Review, Journal of Planning Literature,
Vol. 15, No. 3, pp. 3-23.
Dahlgren, J. (1998), ‘High occupancy vehicle lanes: Not always more effective than general purpose
lanes’, Transportation Research Part A: Policy and Practice, Vol. 32, No. 2, pp. 99-114.
Dalkmann, H., Hutfilter, S., Vogelpohl, K. and P. Schnabel (2008), ‘Sustainable Mobility in Rural China’,
Journal of Environmental Management, Vol. 87, No. 2, pp. 249-261.
Dargay, J. (2008), ‘Personal Transport Choice’, Chapter 3 in OECD Report: Household Behaviour and the
Environment: Reviewing the Evidence. http://www.oecd.org/dataoecd/19/22/42183878.pdf
Dargay, J. and D. Gately (1999), ‘Income's effect on car and vehicle ownership, worldwide: 1960-2015’,
Transportation Research Part A: Policy and Practice, Vol. 33, No. 2, pp. 101-138.
Dargay, J., Gately, D. and M. Sommer (2007), ‘Vehicle Ownership and Income Growth, Worldwide:
1960-2030’, Energy Journal, Vol. 28, No. 4, pp. 143-170.
De Palma, A. and N. Picard (2005), ‘Route choice decision under travel time uncertainty’, Transportation
Research Part A: Policy and Practice, Vol. 39, No. 4, pp. 295–324.
De Sousa, C. A. (2004), ‘The greening of brownfields in American cities’, Journal of Environmental Planning
and Management, Vol. 47, No. 4, pp. 579-600.
Dill, J. and T. Carr (2003) ‘Bicycle Commuting and Facilities in Major U.S. Cities: If You Build Them,
Commuters Will Use Them’, Transportation Research Record: Journal of the Transportation Research Board, Vol.
1828, pp. 116-123.
Dinwoodie, J. (2006), ‘Rail freight and sustainable urban distribution: Potential and practice’, Journal of
Transport Geography, Vol. 14, No. 4, pp. 309-320.
Drewnowski, A. and N. Darmon (2005), ‘The economics of obesity: dietary energy density and energy
cost’, American Journal of Clinical Nutrition, Vol. 82, No. 1, pp. 265S-273S.
Dushnitsky, G and M. J. Lenox (2005), ‘When do firms undertake R&D by investing in new ventures?’,
Strategic Management Journal, Vol. 26, No. 10, pp. 947-965.
ECMT (2007), Cutting Transport CO2 Emissions: What Progress? European Conference of Ministers of
Transport, OECD: Paris.
Eddington, R. (2006), The Eddington Transport Study – Main report: Transport’s role in sustaining the UK’s
productivity and competitiveness, December 2006.
EEA (2005), Overall energy efficiency and specific CO 2 emissions for passenger and freight transport,
European Environment Agency: Copenhagen, November.
http://ims.eionet.europa.eu/Sectors_and_activities/transport/indicators/TERM27%2C2005.11/TERM
_2005_27___Energy_efficiency_final_version.pdf
Ellsberg, D. (1961), ‘Risk, Ambiguity, and the Savage Axioms’, Quarterly Journal of Economics, Vol. 75, No.
4, pp. 643-669.
Enoch, M. and S. Potter (2003), ‘Encouraging the commercial sector to help employees to change their
travel behaviour, Transport Policy, Vol. 10, No. 1, pp. 51-58.
Enoch, M. P. and J. Taylor (2006), ‘A worldwide review of support mechanisms for car clubs’, Transport
Policy, Vol. 13, No. 5, pp. 434-443.
Ericsson, E. (2001), ‘Independent driving pattern factors and their influence on fuel-use and exhaust
emission factors’, Transportation Research Part D: Transport and Environment, Vol. 6, No. 5, pp. 325-345.
Eriksson, L., Garvill, J. and A.M. Nordlund (2008), ‘Acceptability of single and combined transport policy
measures: the importance of environmental and policy specific beliefs’, Transportation Research Part A: Policy
and Practice, Vol. 42, No. 8, pp. 1117-1128.
European Commission (2001), European Transport Policy for 2010: Time to Decide, Luxembourg: Office for
Official Publications of the European Communities,
http://ec.europa.eu/transport/strategies/doc/2001_white_paper/lb_texte_complet_en.pdf
European Commission (2008a), First Thematic Research Summary: Economic Aspects of Sustainable Mobility, DG
Energy and Transport. http://www.transportresearch.info/Upload/Documents/200810/20081003_230251_18361_TRS%20Economic%20Aspects%
20i1.2%20011008.pdf
European Commission (2008b), Thematic Research Summary: Environmental Aspects of Sustainable Mobility, DG
Energy and Transport. http://www.transportresearch.info/Upload/Documents/200810/20081017_172826_89882_TRS%20environmental%20aspect
s.pdf
Eurostat (2007), Panorama of Transport, Office for Official Publications of the European Communities:
Luxembourg.
http://epp.eurostat.ec.europa.eu/cache/ITY_OFFPUB/KS-DA-07-001/EN/KS-DA-07-001-EN.PDF
Facanha, C. and A. Horvath (2006), ‘Environmental Assessment of Freight Transportation in the US’,
International Journal of Life Cycle Analysis, Vol. 11, No. 3, pp. 229-239.
Fellows, N. T. and D. E. Pitfield (2000), ‘An economic and operational evaluation of urban car-sharing’,
Transportation Research Part D: Transport and Environment, Vol. 5, No. 1, pp. 1-10.
Ferguson, E. (1997), ‘The rise and fall of the American carpool: 1970-1990’, Transportation, Vol. 24, No. 4,
pp. 349-376.
Ferreira, L. and J. Sigut (1993), ‘Measuring the performance of intermodal freight terminals’, Transportation
Planning and Technology, Vol. 17, No. 3, pp. 269-280.
Fiat (2009), Annual Report Consolidated and Statutory Financial Statements at 31 December 2008, Fiat Group,
February.
Fichter, K. (2003), ‘E-Commerce: Sorting Out the Environmental Consequences’, Journal of Industrial
Ecology, Vol. 6, No. 2, pp. 25-41.
Fishbein, M.. and I. Ajzen (1975), Belief, attitude, intention, and behavior: An introduction to theory and research.
Reading, MA: Addison-Wesley.
Florio, S. and S. Brownhill (2000), ‘Whatever happened to criticism? Interpreting the London Docklands
Development Corporation’s obituary’, City, Vol. 4, No. 1, pp. 53-64.
Forkenbrock, D. J. (2001), ‘Comparison of external costs of rail and truck freight’, Transportation Research
Part A: Policy and Practice, Vol. 35, No. 4, pp. 321-337.
Frankel, J. A. and D. Romer (1999), ‘Does Trade Cause Growth?’, American Economic Review, Vol. 89, No.
3, pp. 379-399.
Fujii, S. and R. Kitamura (2004), ‘Drivers’ mental representation of travel time and departure time choice
in uncertain traffic network conditions’, Networks and
Spatial Economics, Vol. 4, No. 3, pp. 243–256.
Fujii, A. and A. Taniguchi (2006), ‘Determinants of the effectiveness of travel feedback Programs - a
review of communicative mobility management measures for changing travel behaviour in Japan’,
Transport Policy, Vol. 13, No. 5, pp. 339–348.
Fujii, S. and T. Gaerling (2007), ‘Role and acquisition of car-use habit’, In:
Gaerling, T. and L. Steg (Eds.), Threats to the Quality of Urban Life from
Car Traffic: Problems, Causes, and Solutions, Amsterdam, The Netherlands.
Gardner, B. (2009), ‘Modelling motivation and habit in stable travel mode contexts’, Transportation Research
Part F, Vol. 12, No. 1, pp. 68-76.
Gayda, S. and K. Lautso (2007), ‘Urban Sprawl and Transport’, in Marshall, S. and D. Banister (eds.),
Land Use and Transport: European Research Towards Integrated Transport Policies, Oxford: Elsevier, Chapter 9,
pp. 177-216.
Geurs, K. T. and B. van Wee (2004), ‘Accessibility evaluation of land-use and transport strategies: review
and research directions’, Journal of Transport Geography, Vol. 12, No. 2, pp. 127-140.
Gibson, K. and C. Abbott (2002), ‘City profile: Portland, Oregon’, Cities, Vol. 19, No. 6, pp. 425-436.
Gibson, J. and S. Rozelle (2003), ‘Poverty and Access to Roads in Papua New Guinea’, Economic
Development and Cultural Change, Vol. 52, No. 1, pp. 159-185.
Giuliano, G., Hwang, K. and M. Wachs (1993), ‘Employee Trip Reduction in Southern California: First
Year Results’, Transportation Research Part A: Policy and Practice, Vol. 27, No. 2, pp. 125-137.
Givoni M. and P. Rietveld (2007), ‘The access journey to the railway station and its role in passengers’
satisfaction with rail travel’, Transport Policy, Vol. 14, No. 5, pp. 357-365.
Givoni, M., Brand, C. and P. Watkiss (2009) ‘Are Railways “Climate Friendly”?’, Built Environment, Vol. 35,
No. 1, pp. 70-86.
Glogger, A. F., Zängler, T. W. and G. Karg (2003), The impact of telecommuting on
households’ travel behaviour, expenditures and emissions, Proceedings of the TRIP
research conference, Hillerod, Denmark, February.
Golob, T. F. and D. A. Henscher (1998), ‘Greenhouse gas emissions and Australian commuters’ attitudes
and behaviour concerning abatement policies and personal involvement’, Transportation Research Part D:
Transport and Environment, Vol. 3, No. 1, pp. 1-18.
Goodwin, P. B. (1989), ‘Family changes and public transport use 1984-1987 – A dynamic analysis using
panel data’, Transportation, Vol. 16, No. 2, pp. 121-154.
Goodwin, P. B. (1996), ‘Empirical evidence on induced traffic’, Transportation, Vol. 23, No. 1, pp. 35-54.
Goodwin, P. B. (2008), ‘Policy Incentives to Change Behaviour in Passenger Transport’, paper presented
at the OECD International Transport Forum: Transport and Energy: The Challenge of Climate Change,
Leipzig, May 2008.
Goodwin, P. B. and R. B. Noland (2003), ‘Building new roads really does create extra traffic: a response
to Prakash et al’, Applied Economics, Vol. 35, No. 13, pp. 1451-1457.
Goolsbee, A. (1998), ‘Does Government R&D Policy Mainly Benefit Scientists and Engineers?’, American
Economic Review Papers and Proceedings, Vol. 88, No. 2, pp. 298-302.
Greene D. L. and M. Wegener (1997), ‘Sustainable transport’, Journal of Transport Geography, Vol. 5, No. 3,
pp. 177-190.
Gross, R., Heptonstall, P., Anable, J., Greenacre, P. and E4tech (2009), What policies are effective at reducing
carbon emissions from surface passenger transport? - A review of interventions to encourage behavioural and technological
change, Technology and Policy Assessment Function, UK Energy Research Centre, March.
http://www.ukerc.ac.uk/ResearchProgrammes/TechnologyandPolicyAssessment/0904TransportReport.
aspx
Gwilliam, K. (2002), Cities on the Move: A World Bank Urban Transport Strategy Review, World Bank, August.
http://siteresources.worldbank.org/INTURBANTRANSPORT/Resources/cities_on_the_move.pdf
Gwilliam, K. (2003), ‘Urban Transport in Developing Countries’, Transport Reviews, Vol. 23, No. 2, pp.
197-216.
Ham, S. A., Macera, C. A. and C. Lindley (2005), ‘Trends in Walking for Transportation in the United
States, 1995 and 2001’, Preventing Chronic Disease, Vol. 2., No. 4.
http://www.cdc.gov/pcd/issues/2005/oct/04_0138.htm
Hamer, R., Kroes, E. and H. Van Ooststroom (1991), ‘Teleworking in the Netherlands: an evaluation of
changes in travel behaviour’, Transportation, Vol. 18, No. 4, pp. 365-382.
Hansen, M. and Y. Huang (1997), ‘Road Supply and Traffic in California Urban Areas’, Transportation
Research Part A: Policy and Practice, Vol. 31, No. 3, 1997, pp. 205-218.
Harmsen, R., Kroon, P., Ybema, J.R., Jespersen, M.S., Jordal-Jørgensen., J. (2003), International CO2 Policy
Benchamark for the Road Transport Sector: Results of a Pilot Study, February.
http://www.ecn.nl/docs/library/report/2003/c03001.pdf
Harmsen, R., van den Hoed, R. and M. Harmelink (2007), ‘Improving the Energy Efficiency of Road
Transport: the Case of Eco-Driving in the Netherlands’, European Council for an Energy Efficient
Economy Conference.
Harpaz, I. (2002), ‘Advantages and disadvantages of telecommuting for the individual, organization and
society’, Work Study, Vol. 51, No. 2, pp. 74-80.
Haskell, W. L., Lee, I-M., Pate, R. R., Powell, K. E., Blair, S. N., Franklin, B. A., Macera, C.A., Heath, G.
W., Thompson, P.D. and A. Bauman (2007), ‘Physical Activity and Public Health Updated
Recommendation for Adults From the American College of Sports Medicine and the American Heart
Association’, Circulation, Vol. 116, No. 9, pp. 1081-1093.
Henstra, D., Ruijgrok, C. and L. Tavasszy (2007), ‘Globalised trade, logistics and intermodality: European
perspectives’, in Leinbach, T. R. and C. Capineri (Eds.), Globalized Freight Transport: Intermodality, ECommerce, Logistics and Sustainability, Cheltenham, Edward Elgar, Chapter 5, pp. 135-163.
Hickman, R. and D. Banister (2007), ‘Looking over the horizon: transport and reduced CO2 emissions in
the UK by 2030’, Transport Policy, Vol. 14, No. 5, pp. 377-387.
Higa, K. and J. Wijayanayake (1998), ‘Telework in Japan: Perceptions and Implementation’, Proceedings of
the Thirty-first Hawaii International Conferece on System Sciences, Vol. 4, pp. 169–177.
Higgins, P. A. T. (2005), ‘Exercise-based transportation reduces oil dependence, carbon emissions and
obesity’, Environmental Conservation, Vol. 32, No. 3, pp. 197-202.
Hills, P. J. (1996), ‘What is induced traffic?’, Transportation, Vol. 23, No. 1, pp. 5-16.
Hine, J. and M. Grieco (2003), ‘Scatters and clusters in time and space: implications for delivering
integrated and inclusive transport’, Transport Policy, Vol. 10, No. 4, pp. 299-306.
Hine, J. and J. Scott (2000), ‘Seamless, accessible travel: users' views of the public transport journey and
interchange’, Transport Policy, Vol. 7, No. 3, pp. 217-226.
Hook, W. (2000), Improving Conditions for Non Motorized Transport in Surabya, Indonesia: A Pilot Project inTwo
Neighbourhoods, Eschborn: GTZ.
Hook, W. and M. Replogle (1996), ‘Motorization and non-motorized transport in Asia: Transport system
evolution in China, Japan and Indonesia’, Land Use Policy, Vol. 13, No. 1, pp. 69-84.
Hopkinson, P. and P. James (2003), Sustainable Telework - Assessing and Optimising the Ecological and
Social Benefits of Teleworking, February.
http://www.sustel.org/documents/deliverables%20-%20WP2/D10%20%20National%20Reports/154170_154123_Final_UK_natreport.pdf
Hopkinson, P. and M. Wardman (1996), ‘Evaluating the demand for new cycle facilities’, Transport Policy,
Vol. 3, No. 4, pp. 241-249.
Hotopp, U. (2002), ‘Teleworking in the UK’, Labour Market Trends, Vol. 110, No. 6, pp. 311-318.
Howe, J. and A. Davis (2002), Boda Boda – Uganda’s Rural and Urban Low-Capacity Transport Services,
presented at Codatu X Conference, Lomé, Togo, 12-15 November.
http://www.transportlinks.org/transport_links/filearea/publications/1_792_PA3831%20Boda%20Boda%20Codatu%20Final
%202.pdf
Hu, G., Qiao, Q., Silventoinen, K., Eriksson, J. G., Jousilahti, P., Lindström, J., Valle, T. T., Nissinen, A.
and J. Tuomilehto (2003), ‘Occupational, commuting, and leisure-time physical activity in relation to risk
for Type 2 diabetes in middle-aged Finnish men and women’, Diabetologia, Vol. 36, No. 3, pp. 322-329.
Hu, G., Jousilahti, P., Borodulin, K., Barengo, N. C., Lakka, T. A., Nissinen, A. and J. Tuomilehto (2007),
‘Occupational, commuting and leisure-time physical activity in relation to coronary heart disease among
middle-aged Finnish men and women’, Atherosclerosis, Vol. 194, No. 2, pp. 490-497.
Hu, P. S. and Reuscher, T. R. (2004), Summary of Travel Trends 2001 National Household Travel Survey,
prepared for US Department of Transportation Federal Highway Administration, Washington, DC.
Huang, H-J., Yang, H. and M. G. H. Bell (2000), ‘The models and economics of carpools’, Annals of
Regional Science, Vol. 34, No. 1, pp. 55-68.
Hull, A. (2005), ‘Integrated transport planning in the UK: From concept to reality’, Journal of Transport
Geography, Vol. 13, No. 4, pp.318-328.
Hunt, J. D. and J. E. Abraham (2007), ‘Influences on bicycle use’, Transportation, Vol. 34, No. 4, pp. 453470.
ICARO (1999), Implementation Guidelines for Increasing Car Occupancy, Directorate General for Transport
DGVII, Brussels.
ICF Consulting (2002), Economic Effects of Transportation: The Freight Story, Final report prepared for the
Federal Highway Administration of the US Department of Transport, Fairfax, VA, January.
http://ops.fhwa.dot.gov/freight/documents/improve_econ.pdf
IEA (2001), Saving Oil And Reducing CO2 Emissions In Transport: Options & Strategies, International Energy
Agency, OECD, Paris.
IEA (2008), From 1st to 2nd Generation Biofuel Technologies: An overview of current industry and RD&D activities,
International Energy Agency, OECD, November.
http://www.iea.org/textbase/papers/2008/2nd_Biofuel_Gen.pdf
Iwasa, K. (2001), ‘Rail Freight in Japan – The Situation Today and Challenges for Tomorrow’, Japan
Railway & Transport Review, Vol. 26, pp. 8-17.
Jacobsen, P. L. (2003), ‘Safety in numbers: more walkers and bicyclists, safer walking and bicycling’, Injury
Prevention, Vol. 9, No. 3, pp. 205-209.
Jacobson, S. H. and D. M. King (2009), ‘Fuel saving and ridesharing in the US: Motivations, limitations,
and opportunities’, Transportation Research Part D: Transport and Environment, Vol. 14, No. 1, pp. 14-21.
Jacoby, H. G. and B. Minten (2009), ‘On Measuring the Benefits of Lower Transport Costs’, Journal of
Development Economics, Vol. 89, No. 1, pp. 28-38.
Jacometti, S. (2008), Creating and sustaining a behavioural change in energy conservation - The role of Foundations,
MSc Dissertation, Master of Science in Environmental Technology, Imperial College London, September.
Jaffe, A. B. (1986), ‘Technological Opportunity and Spillovers of R & D: Evidence from Firms' Patents,
Profits, and Market Value’, American Economic Review, Vol. 76, No. 5, pp. 984-1001.
James, P. and P. Hopkinson (2006), Conferencing at BT - Results of a Survey on its Economic, Environmental and
Social Impacts, SustainIT, UK Centre for Economic and Environmental Development, July.
http://www.btplc.com/Societyandenvironment/Ourapproach/CSRresources/Reports/BTconferencings
urvey2007.pdf
James, P. T., Rigby, N. and R. Leach (2004), ‘The obesity epidemic, metabolic syndrome and future
prevention strategies’, European Journal of Cardiovascular Prevention and Rehabilitation, Vol. 11, No. 1, pp. 3-8.
Janelle, D. G., (2004), ‘Impact of Information Technologies’, in Hanson, S. and G. Giuliano (Eds.), The
Geography of Urban Transportation, Third Edition, New York,
NY: The Guilford Press, Chapter 4, pp. 87-112.
Janic, M. and A. Reggiani (2001), ‘Integrated transport systems in the European Union: an overview of
some recent developments’, Transport Reviews, Vol. 21, No. 4, pp. 469-497.
Jansson, J. O. (2008), ‘Public transport policy for central-city travel in the light of recent experiences of
congestion charging’, Research in Transportation Economics, Vol. 22, No. 1, pp. 179-187.
Johnston, R. A. and R. Ceerla (1996), ‘The effects of new high-occupancy vehicle lanes on travel and
emissions’, Transportation Research Part A: Policy and Practice, Vol. 30, No. 1, pp. 35-50.
Jones, C. (2005), ‘The Trading Dragon: Boosting Canada’s Transportation Infrastructure to
Accommodate the New China Syndrome’, Options Politiques, Vol. 27, No. 1, pp. 78-83.
Jorgensen, R. E., (1947), ‘Influence of expressways in diverting traffic from alternate routes and
generating new traffic’, Proceedings of 27th Annual Highway Research Board Meeting.
Jou, R.-C., Kitamura, R., Weng, M.-C., and C.-C. Chen (2008), ‘Dynamic commuter departure time choice
under uncertainty’, Transportation Research Part A: Policy and Practice, Vol. 42, No. 5, pp. 774–783.
Kahn, M. E. (2007), ‘Do greens drive Hummers or hybrids? Environmental ideology as a determinant of
consumer choice’, Journal of Environmental Economics and Management, Vol. 54, No. 2, pp.129–145.
Kahn Ribeiro, S., Kobayashi, S., Beuthe, M., Gasca, J., Greene, D., Lee, D.S., Muromachi, Y., Newton,
P.J., Plotkin, S., Sperling, D., Wit, R. and P. J. Zhou (2007), ‘Transport and its infrastructure’, in Metz, B.,
Davidson, O.R., Bosch, P.R., Dave, R. and L.A. Meyer (Eds.), Climate Change 2007: Mitigation - Contribution
of Working Group III to the Fourth Assessment Report of the Intergovernmental Panel on Climate Change, Cambridge,
UK and New York, US: Cambridge University Press.
Kahneman, D. and A. Tversky (1979), ‘Prospect Theory: An Analysis of Decision Under Risk’,
Econometrica, Vol. 47, No. 2, pp. 263-291.
Kahneman, D. and A. Tversky (1984), ‘Choices, Values and Frames’, American Psychologist, Vol. 39, No. 12,
pp. 341-350.
Kamien, M. I., Muller, E. and I. Zang (1992), ‘Research Joint Ventures and R&D Cartels’, American
Economic Review, Vol. 82, No. 5, pp. 1293-1306.
Kemp, R. (2007), Traction energy metrics, Research Programme, Rail Safety & Standards Board, December.
http://www.rssb.co.uk/pdf/reports/research/T618_traction-energy-metrics_final.pdf
Kenworthy, J. R. and F. B. Laube (1996), ‘Automobile dependence in cities: An international comparison
of urban transport and land use patterns with implications for sustainability’, Environmental Impact
Assessment Review, Vol. 16, No. 4-6, pp. 279-308.
Kenworthy, J. R. and F. B. Laube (1999), ‘Patterns of automobile dependence in cities: an international
overview of key physical and economic dimensions with some implications for urban policy’,
Transportation Research Part A: Policy and Practice, Vol. 33, No. 7-8, pp. 691-723.
Kenyon, S., and G. Lyons (2003), ‘The value of integrated multimodal traveller information and its
potential contribution to modal change’, Transportation Research Part F, Vol. 6, No. 1, pp. 1–21.
Kenyon, S., Lyons, G. and J. Rafferty (2002), ‘Transport and social exclusion: investigating the possibility
of promoting inclusion through virtual mobility’, Journal of Transport Geography, Vol. 10, No. 3, pp. 207219.
Khandker, S. R., Bakht, Z., and G. B. Koolwal (2009), ‘The Poverty Impact of Rural Roads: Evidence
from Bangladesh,’ Economic Development and Cultural Change, Vol. 57, No. 4, pp. 685-722.
Kitamura, R., Mokhatarian, P. L. and L. Daidet (1997), ‘A micro-analysis of land use and travel in five
neighborhoods in the San Francisco Bay Area’, Transportation, Vol. 24, No. 2, pp.125-158.
Kitou, E. and A. Horvath (2006), ‘Transportation Choices and Air Pollution Effects of Telework’, Journal
of Infrastructure Systems, Vol. 12, No. 2, pp. 121-134.
Klibanoff, P., Marinacci, M. and S. Mukerji (2005), ‘A Smooth Model of Decision Making under
Ambiguity’, Econometrica, Vol. 73, No. 6, pp. 1849-1892.
Knoflacher, H. (2006), ‘A new way to organize parking: the key to a successful sustainable transport
system for the future’, Environment and Urbanization, Vol. 18, No. 2, pp. 387-400.
Koenig, B. E., Henderson D. K. and P. L. Mohktarian (1996), ‘The Travel and Emissions Impacts of
Telecommuting for the State of California Telecommuting Pilot Project’, Transportation Research Part C:
Emerging Technologies, Vol. 4, No. 1, pp. 13-32.
Komanoff, C. and C. Roelofs (1993), Case Study No. 15: The Environmental Benefits Of Bicycling And Walking,
National Bicycling And Walking Study, U.S. Department of Transportation, Federal Highway
Administration.
Kremer, M., Chaudhury, N., Rogers, F. H., Muralidharan, K. and J. Hammer (2005), ‘Teacher Absence in
India: A Snapshot’, Journal of the European Economic Association, Vol. 3, No. 2-3, pp. 658-667.
Krizek, K. J. (2007), ‘Estimating the Economic Benefits of Bicycling and Bicycle Facilities: an Interpretive
Review and Proposed Methods’, in Coto-Millán, P and V. Inglada (eds.), Essays on Transport Economics,
Springer, Chapter 13, pp. 219-244.
Krizek, K. J., Barnes, G. and K. Thompson (2009), ‘Analyzing the effect of bicycle facilities on commute
mode share over time’, Journal of Urban Planning and Development, Vol. 135, No. 2, pp. 66-73.
Krizek, K. J. and R. W. Roland (2005), ‘What is at the end of the road? Understanding discontinuities of
on-street bicycle lanes in urban settings’, Transportation Research Part D: Transport and Environment, Vol. 10,
No. 1, pp 55-68.
Kwon, J. and P. Varaiya (2008), ‘Effectiveness of California’s High Occupancy Vehicle (HOV) system’,
Transportation Research Part C: Emerging Technologies, Vol. 16, No. 1, pp. 98-115.
Lam, S. H. and T. D. Toan (2006), ‘Land transport policy and public transport in Singapore’,
Transportation, Vol. 33, No. 2, pp. 171-188.
Lautso, K., Spiekermann, K., Wegener, M., Sheppard, I. Steadman, P., Martina, A., Domingo, R. and S.
Gayda (2004), PROPOLIS: Planning and Research of Policies for Land Use and Transport for Increasing Urban
Sustainability, Final Report, Second Edition, Project Funded by the European Commission under the Energy,
Environment and Sustainable Development Thematic Programme of the Fifth RTD Framework
Programme, Helsinki, February. http://www.ltcon.fi/propolis
Ledbury, M. (2007), Car Clubs, Quick Hits No. 4, UK Energy Research Centre, September.
http://www.ukerc.ac.uk/Downloads/PDF/07/0709QHcarclub.pdf
Levin, I. P. (1982), ‘Measuring tradeoffs in carpool driving arrangement preferences’, Transportation, Vol.
11, No. 1, pp. 71-85.
Limao, N., Venables, A. J. (2001), ‘Infrastructure, Geographical Disadvantage, Transport Costs, and
Trade’, World Bank Economic Review, Vol. 15, No. 3, pp. 451-479.
Lindqvist, E. amd G. Tegner (1998), Measures to reduce the CO2 emissions from the transport sector in the city of
Stockholm, Proceedings of the 1998 4th International Conference on Urban Transport and the
Environment, Computational Mechanics Publications, Ashurst, England, Lisbon, Portugal, pp. 349-358.
Litman, T. (2004), Quantifying the Benefits of Nonmotorized Transportation For Achieving Mobility Management
Objectives, Victoria Transport Policy Institute, November.
Litman, T. (2007), Economic Value of Walkability, Victoria Transport Policy Institute, December.
Lokshin, M. and R. Yemtsov (2005), ‘Has Rural Infrastructure Rehabilitation in Georgia Helped the
Poor?’, World Bank Economic Review, Vol. 19, No. 2, pp.311-333.
Lucas, K. (2006), ‘Providing transport for social inclusion within a framework for environmental justice in
the UK’, Transportation Research Part A: Policy and Practice, Vol. 40, No. 10, pp. 801-809.
Lundquist Noblet, C., Teisl, M. F. and J. Rubin (2006), ‘Factors affecting consumer assessment of ecolabeled vehicles’, Transportation Research Part D: Transport and Environment, Vol. 11, No. 6, pp. 422–431.
Lyons, G. and R. Harman (2002), ‘The UK public transport industry and provision of multi-modal
traveller information’, International Journal of Transport Management, Vol. 1, No. 1, pp. 1–13.
Lythgoe, W. F. and M. Wardman (2004), ‘Modelling passenger demand for parkway rail stations’,
Transportation, Vol. 31, No. 2, pp.125-151.
Maastricht Treaty (1992) Provisions Amending The Treaty Establishing The European Economic Community With A
View To Establishing The European Community, Maastricht, 7 February.
http://www.eurotreaties.com/maastrichtec.pdf
MacDonald, M. (2006), Social Inclusion: Transport Aspects, Final Report, Centre for Transport Studies,
Imperial College, March.
Macharis, C. and Y. M. Bontekoning (2004), ‘Opportunities for OR in intermodal freight transport
research: A review’, European Journal of Operational Research, Vol. 153, No. 2, pp. 400-416.
Marshall, S. and D. Banister (2000), ‘Travel reduction strategies: intentions and outcomes’, Transportation
Research Part A: Policy and Practice, Vol. 34, No. 5, pp. 321-338.
Martens, M. J. and S. van Griethuysen (1999), The ABC location policy in the Netherlands. ‘The right business at
the right place’. Delft: TNO-INRO. https://dspace.ist.utl.pt/bitstream/2295/296481/1/abc.pdf
Martens, K. (2004), ‘The Bicycle as a Feedering Mode: Experiences from Three European Countries’,
Transportation Research Part D: Transport and Environment, Vol. 9, No. 4, pp. 281-294.
Matas, A. (2004), ‘Demand and Revenue Implications of an Integrated Public Transport Policy: The Case
of Madrid’, Transport Reviews, Vol. 24, No. 2, pp. 195-217.
Matthews, C. E., Jurj, A. L., Shu, X-o., Li, H.-L., Yang, G., Li, Q., Gao, Y.-T. and W. Zheng (2007),
‘Influence of Exercise, Walking, Cycling, and Overall Nonexercise Physical Activity on Mortality in
Chinese Women’, American Journal of Epidemiology, Vol. 165, No. 12, pp. 1343–1350.
Matthews, H. S. and E. Williams (2005), ‘Telework Adoption and Energy Use in Building and Transport
Sectors in the United States and Japan’, Journal of Infrastructure Systems, Vol. 11, No. 1, pp. 21-30.
Matthews, H.S., Hendrickson C.T. and D.L. Soh (2001), ‘Environmental and economic effects of ecommerce: A case study of book publishing and retail logistics’, Transportation Research Record, No. 1763,
pp. 6-19.
May, A.D. (2004), ‘Singapore: the development of a world class transport system’, Transport Reviews, Vol.
24, No. 1, pp. 79-101.
May, A.D., Kelly, C. and S. Shepherd (2006), ‘The principles of integration in urban transport strategies’,
Transport Policy, Vol. 13, No. 4, pp. 319-327.
McKinnon, A. C. and Y. Ge (2006), ‘The potential for reducing empty running by trucks: a retrospective
analysis’, International Journal of Physical Distribution & Logistics Management, Vol. 36, No. 5, pp. 391-410.
McKinsey & Company (2009), Roads toward a low-carbon future: Reducing CO2 emissions from passenger vehicles in
the global road transportation system, McKinsey & Company, New York City.
http://www.mckinsey.com/clientservice/ccsi/pdf/roads_toward_low_carbon_future.pdf
Meek, S., Ison, S. and M. Enoch (2008), ‘Role of Bus-Based Park and Ride in the UK: A Temporal and
Evaluative Review’, Transport Reviews, Vol. 28, No. 6, pp. 781-803.
Menendez, M. and C. F. Daganzo (2007), ‘Effects of HOV lanes on freeway bottlenecks’, Transportation
Research Part B: Methodological, Vol. 41, No. 8, pp. 809-822.
Metz, D. (2007), ‘Eddington’s Conundrum and unresolved questions’, Traffic Engineering and Control, Vol.
48, No. 4, pp. 172-174.
Metz, D. (2008), The Limits to Travel: How Far will You Go?, London: Earthscan.
Mitomo, H. and T. Jitsuzumi (1999), ‘Impact of telecommuting on mass transit congestion: the Tokyo
case’, Telecommunications Policy, Vol. 23, No. 10-11, pp. 741-751.
Mohring, H. (1972), ‘Optimization and Scale Economies in Urban Bus Transportation’, American Economic
Review, Vol. 62, No. 4, pp. 591-604.
Mokhtarian, P. L. (1991), ‘Telecommuting and travel: state of the practice, state of the art’, Transportation,
Vol. 18, No. 4, pp. 319-342.
Mokhtarian, P. L. (1997), ‘Now that travel can be virtual, will congestion virtually disappear?’, Scientific
American, Vol. 277, No. 4, p. 93.
Mokhtarian, P. L. (2004), ‘A conceptual analysis of the transportation impacts of B2C e-commerce’,
Transportation, Vol. 31, No. 3, pp. 257-284.
Molina, M. J. and L. T. Molina (2004), Megacities and Atmospheric Pollution, 2004 Critical Review Summary,
Massachusetts Institute of Technology.
http://peacefoundation.net.7host.com/file/Megacities%20and%20Atmospheric%20Pollution%20(Molina).pdf
Moser, C. (1996), Confronting Crisis : A Summary of Household Responses to Poverty and Vulnerability in Four, Poor
Urban Communities, Environmentally Sustainable Development Studies and Monographs Series No. 7, The
World Bank, Washington, D.C.
Möser, G. and S. Bamberg (2008), ‘The effectiveness of soft transport policy measures: A critical
assessment and meta-analysis of empirical evidence’, Journal of Environmental Psychology, Vol. 28, No. 1, pp.
10-26.
Moudon, A. V. and C. Lee (2003) ‘Walking and Bicycling: An Evaluation of Environmental Audit
Instruments’, American Journal of Health Promotion, Vol. 18, No. 1, pp. 21-37.
Moudon, A. V., Lee, C., Cheadle, A. D., Collier, C. W., Johnson, D., Schmid, T. L. and R. D. Weather
(2005), ‘Cycling and the built environment, a US perspective’, Transportation Research Part D: Transport and
Environment, Vol. 10, No. 3, pp. 245-261.
Mu, R. and D. Van de Walle (2007), Rural Roads and Poor Area Development in Vietnam, Working Paper
4340, World Bank Policy Research, World Bank Development Research Group, Human Development
and Public Services Team, August.
Nadiri, M. I. and T. P. Mamuneas (1994), ‘The Effects of Public Infrastructure and R & D Capital on the
Cost Structure and Performance of U.S. Manufacturing Industries’, Review of Economics and Statistics, Vol.
76, No. 1, pp. 22-37.
Naess, P. (1995), Urban form and energy use for transportation. A nordic experience, Norwegian
Institute of Technology, Trondheim.
Naess, P. and S. L. Sandberg (1996), ‘Workplace location, modal split and energy use for commuting
trips’, Urban Studies, Vol. 33, No. 3, pp. 357–380.
Nair, P. and D. Kumar (2005), ‘Transformation in Road Transport System in Bogotá: An Overview’,
ICFAI Journal of Infrastructure, September, pp. 20-28.
Nantulya, V. M. and M. R. Reich (2002), ‘The neglected epidemic: road traffic injuries in developing
countries’, British Medical Journal, Vol. 324, No. 7346, pp. 1139-1141.
Nelson, A. C. and D. Allen (1997), ‘If You Build Them, Commuters Will Use Them: Association
Between Bicycle Facilities and Bicycle Commuting’, Transportation Research Record: Journal of the Transportation
Research Board, Vol. 1578, pp. 79-83.
Newman, P. W. G. and J. R. Kenworthy (1996), ‘The land use-transport connection: An overview’, Land
Use Policy, Vol. 13, No. 1, pp. 1-22.
Nilles, J. (1988), ‘Traffic reductions by telecommuting: a status report and selected bibliography’,
Transportation Research Part A: General, Vol. 22, No. 4, pp. 301–317.
Njenga, P. and A. Davis (2003), ‘Drawing the road map to rural poverty reduction’, Transport Reviews, Vol.
23, No. 2, pp. 217–241.
Noland, R. B. (1995), ‘Perceived Risk and Modal Choice: Risk Compensation In Transportation Systems’,
Accident Analysis and Prevention, Vol. 27, No. 4, pp. 503-521.
Noland, R. B. (2007), ‘Transport planning and environmental assessment: implications of induced travel
effects’, International Journal of Sustainable Transportation, Vol. 1, No. 1, pp. 1-28.
Noland, R. B. and M. M. Ishaque (2006), ‘Smart Bicycles in an Urban Area: Evaluation of a Pilot Scheme
in London’, Journal of Public Transportation, Vol. 9, No. 5, pp. 71-95.
Noland, R. B. and H. Kunreuther (1995), ‘Short-run and long-run policies for increasing bicycle
transportation for daily commuter trips’, Transport Policy, Vol. 2, No. 1, pp. 67-79.
OECD (2002), Strategies to Reduce Greenhouse Gas Emissions from Road Transport: Analytical Methods,
Organisation for Economic Co-operation and Development, OECD: Paris.
OECD (2008), Science and Technology Statistics Main Science and Technology Indicators, Volume 2008 release 01,
OECD: Paris.
OECD (2009), Science and Technology Statistics Main Science and Technology Indicators, Volume 2009 release 01,
OECD: Paris.
Ogden, C. L., Carroll, M. D., Curtin, L. R., McDowell, M. A., Tabak, C. J. and K. M. Flegal (2006),
‘Prevalence of Overweight and Obesity in the United States, 1999-2004’, Journal of the American Medical
Association, Vol. 295, No. 13, pp. 1549-1555.
Ogden, J. M., Steinbugler, M. M. and T. G. Kreutz (1999), ‘A comparison of hydrogen, methanol and
gasoline as fuels for fuel cell vehicles: implications for vehicle design and infrastructure development’,
Journal of Power Sources, Vol. 79, No. 2, pp.143-168.
Ogilvie, D., Egan, M., Hamilton, V. and M. Petticrew (2004), ‘Promoting walking and cycling as an
alternative to using cars: systematic review’, British Medical Journal, Vol. 329, No. 7469, pp. 763-766.
Olszewski, P. S. (2007), ‘Singapore motorisation restraint and its implications on travel behaviour and
urban sustainability’, Transportation, Vol. 34, No. 3, pp. 319-335.
Onaka, I. and V. Peltokorpi (2006), ‘Knowledge Based view of Radical Innovation: Toyota Prius Case’, in
Hage, J and M. T. H. Meeus, Innovation, Science, and Institutional Change, OUP: New York, Chapter 4, pp. 88104.
O’Neil, W. (1896), ‘In Praise of Cycling’, Lancet, Vol. 147, No. 3797, pp. 1591-1592.
Ory, D. T. and P. L. Mokhtarian (2006), ‘Which Came First, the Telecommuting or the Residential
Relocation? An Empirical Analysis of Causality’, Urban Geography, Vol. 27, No. 7, pp. 590-609.
Owen, N., Humpel, N., Leslie, E., Bauman, A., and J. F. Sallis (2004), ‘Understanding Environmental
Influences on Walking Review and Research Agenda’, American Journal of Preventive Medicine, Vol. 27, No. 1,
pp. 67-76.
Parkany, E., Gallagher, R. and P. Viveiros (2004), ‘Are Attitudes Important in Travel Choices?’,
Transportation Research Record, No. 1894, pp.127-139.
Parkhurst, G. (2000), ‘Influence of bus-based park and ride facilities on users' car traffic’, Transport Policy,
Vol. 7, No. 2, pp. 159-172.
Parry, I. W. H. and A. M. Bento (2000), ‘Tax deductions, environmental policy, and the “double
dividend” hypothesis’, Journal of Environmental Economics and Management, Vol. 39, No. 1, pp. 67-96.
Parry, I. W. H. and K. A. Small (2009), ‘Should Urban Transit Subsidies Be Reduced?’, American Economic
Review, Vol. 99, No. 3, pp. 700-724.
Pedler, A. and N. Paulley (2000), Transland: The Integration of Transport and Land Use Planning, paper
presented at the European Transport Conference 2000 www.etcproceedings.org/paper/download/2593
Phang, S.-Y. (2003), ‘Strategic development of airport and rail infrastructure: the case of Singapore’,
Transport Policy, Vol. 10, No. 1, pp. 27-33.
Plaut, P. (2005), ‘Non-motorized commuting in the US’, Transportation Research Part D: Transport and
Environment, Vol. 10, No. 5, pp. 347–356.
Porter, G. (2002), ‘Living in a Walking World: Rural Mobility and Social Equity Issues in Sub-Saharan
Africa’, World Development, Vol. 30, No. 2, pp. 285-300.
Potter, E. E. (2003), ‘Telecommuting: The Future of Work, Corporate Culture, and American Society’,
Journal of Labor Research, Vol. 24, No. 1, pp. 73-84.
Prakash, A. B., Oliver, E. H. D’ A. and K. Balcombe (2001), ‘Does building new roads really create extra
traffic? Some new evidence’, Applied Economics, Vol. 33, pp. 1579-1585.
Prentice, A. M. (2006), ‘The emerging epidemic of obesity in developing countries’, International Journal of
Epidemiology, Vol. 35, No. 1, pp. 93-99.
Preston, J. (2008), ‘Public Transport Subsidisation’, in Ison, S. and T. Rye (eds.) The Implementation and
Effectiveness of Transport Demand Management’ Measures: An International Perspective, Ashgate, Chapter 10, pp.
189-211.
Priemus, H. (2007), ‘Development and design of large infrastructure projects: disregarded alternatives and
issues of spatial planning’, Environment and Planning B: Planning and Design, Vol. 34, No. 4, pp. 626-644.
Psaraftis, H. N. (2005), ‘EU Ports Policy: Where do we Go from Here?’, Maritime Economics & Logistics,
Vol. 7, No. 1, pp. 73-82.
Pucher, J. (1998), ‘Urban transport in Germany: providing feasible alternatives to the car’, Transport
Reviews, Vol. 18, No. 4, pp. 285-310.
Pucher, J. and R. Buehler (2006), ‘Why Canadians cycle more than Americans: A comparative analysis of
bicycling trends and policies’, Transport Policy, Vol. 13, No. 3, pp. 265-279.
Pucher, J. and R. Buehler (2008), ‘Making Cycling Irresistible: Lessons from The Netherlands, Denmark
and Germany’, Transport Reviews, Vol. 28, No. 4, pp. 495–528.
Pucher, J. and L. Dijkstra (2000), ‘Making Walking and Cycling Safer: Lessons from Europe’,
Transportation Quarterly, Vol. 54, No. 3, pp. 25-50.
Pucher, J. and L. Dijkstra (2003), ‘Promoting Safe Walking and Cycling to Improve Public Health:
Lessons From The Netherlands and Germany’, American Journal of Public Health, Vol. 93, No. 9, pp. 15091516.
Pucher, J. and J.L. Renne (2003), ‘Socioeconomics of Urban Travel: Evidence from the 2001 NHTS’,
Transportation Quarterly, Vol. 57, No. 3, pp. 49-77.
Pucher, J., Komanoff, C., and P. Schmiek (1999), ‘Bicycling renaissance in North America?: Recent trends
and alternative policies to promote bicycling’, Transportation Research Part A: Policy and Practice, Vol. 33, No.
7-8, pp. 625-654.
Rabinovitch, J. (1996), ‘Innovative land use and public transport policy: The case of Curitiba, Brazil’, Land
Use Policy, Vol. 13, No. 1, pp. 51-67.
Raupach, M. R., Marland, G., Ciais, P., Le Quere, C., Canadell, J. G., Klepper, G. and C. B. Field (2007),
‘Global and Regional Drivers of Accelerating CO2 Emissions’, PNAS, Vol. 104, No. 24, pp. 10288-10293.
Rietveld, P. (2000), ‘The accessibility of railway stations: the role of the bicycle in The Netherlands’,
Transportation Research Part D: Transport and Environment, Vol. 5, No. 1, pp. 71-75.
Rietveld P., Daniel, V. (2004), ‘Determinants of bicycle use: do municipal policies matter?’, Transportation
Research Part A: Policy and Practice, Vol. 38, No. 7, pp. 531-550.
Rivara, F. P., Thompson, D. C., Patterson, M. Q. and R. S. Thompson (1998), ‘Prevention of BicycleRelated Injuries: Helmets, Education, and Legislation’, Annual Review of Public Health, Vol. 19, pp. 293-318.
Rivara, F. P., Thompson, D. C. and R. S. Thompson (1997), ‘Epidemiology of bicycle injuries and risk
factors for serious injury’, Injury Prevention, Vol. 3, No. 2, pp. 110-114.
Rivara, F. P., Thompson, D. C., Thompson, R. S., Rogers, L. W., Alexander, B., Felix, D. and A. B.
Bergman (1994), ‘The Seattle Children's Bicycle Helmet Campaign: Changes in Helmet Use and Head
Injury Admissions’, Pediatrics, Vol. 93, No. 4, pp. 567-569.
Roberts, M., Turner, C., Greenfield, S. and G. Osborn (2006), ‘A continental ambience? Lessons in
managing alcohol-related evening and night-time entertainment from four European capitals’, Urban
Studies, Vol. 43, No. 7, pp. 1105-1125.
Robinson, D. L. (2005), ‘Safety in numbers in Australia: more walkers and bicyclists, safer walking and
bicycling’, Health Promotion Journal of Australia, Vol. 16, No. 1, pp. 47-51.
Robinson, D. L. (2006), ‘No clear evidence from countries that have enforced the wearing of helmets’,
British Medical Journal, Vol. 332, No. 7543, pp. 722-725.
ROCOL (2000), Road Charging Options for London: A Technical Assessment, Review of Charging
Options for London Working Group, London: HMSO.
http://www.gos.gov.uk/gol/161402/267325/440302/?view=Standard
Romer, P. M. (1990), ‘Endogenous Technological Change’, Journal of Political Economy, Vol. 98, No. 5, pp.
S71- S102.
Rydén, C. and E. Morin (2005), Mobility Services for Urban Sustainability: Environmental Assessment, Report
Working Paper 6, Trivector Traffic AB, Stockholm, Sweden, January.
Rye, T. (2002), ‘Travel plans: do they work?’, Transport Policy, Vol. 9, No. 4, pp. 287-298.
Rye, T. and S. Ison (2005), ‘Overcoming barriers to the implementation of car parking charges at UK
workplaces’, Transport Policy, Vol. 12, No. 1, pp. 57-64.
Saboohi, Y. and H. Farzaneh (2009), ‘Model for developing an eco-driving strategy of a passenger vehicle
based on the least fuel consumption’, Applied Energy, Vol. 86, No. 10, pp. 1925-1932.
SACTRA (1994), Trunk Roads and the Generation of Traffic, Standing Advisory Committee on Trunk Road
Assessment, UK Department of Transport, London: HMSO.
Saelens, B. E., Sallis, J. F. and L. D. Frank (2003), ‘Environmental Correlates of Walking and Cycling:
Findings From the Transportation, Urban Design, and Planning Literatures’, Environment and Physical
Activity, Vol. 25, No. 2, pp. 80-91.
Salomon, I. (1998) ‘Technological change and social forecasting: the case of telecommuting as a travel
substitute’, Transportation Research Part C: Emerging Technologies, Vol. 6, No.1-2, pp. 17-45.
Sanchez, T. W. (1999), ‘The Connection Between Public Transit and Employment’, Journal of the American
Planning Association, Vol. 65, No. 3, pp. 284-296.
Santos, G. (2004), ‘Urban Congestion Charging: A Second-Best Alternative’, Journal of Transport Economics
and Policy, Vol. 38, No. 3, pp. 345-369.
Santos, G. (2008), ‘The London Congestion Charging Scheme’, Brookings Wharton Papers on Urban Affairs,
pp. 177-234.
http://muse.jhu.edu/journals/brookings-wharton_papers_on_urban_affairs/toc/urb.2008.html
Santos, G. and G. Fraser (2006), ‘Road Pricing: Lessons from London’, Economic Policy, Vol. 21, No. 46,
pp. 263-310.
Santos, G. and B. Shaffer (2004), ‘Preliminary Results of the London Congestion Charging Scheme’,
Public Works, Management and Policy, Vol. 9, No. 2, pp. 164-181.
http://pwm.sagepub.com/cgi/reprint/9/2/164
Santos, G., Li, W. and W. Koh (2004), ‘Transport Policies in Singapore’, in Santos, G. (ed.), Road Pricing:
Theory and Evidence, Oxford: Elsevier, Chapter 9, pp. 209-235.
Schäfer, A., Heywood, J.B., Jacoby, H.D. and I.A. Waitz (2009), Transportation in a climate-constrained world,
Cambridge, Mass., London: MIT Press.
Schipper, L. J. and L. Fulton (2003), ‘Carbon dioxide emissions from transportation: trends, driving
factors, and forces for change’, in Hensher, D. A. and K. J. Button (Eds.), Handbook of Transport and the
Environment, Elsevier: Amsterdam/London, Chapter 11, pp. 203-225.
Schwanen, T. (2002), ‘Urban Form and Commuting Behaviour: A Cross-European Perspective’, Tijdschrift
voor Economische en Sociale Geografie, Vol. 93, No. 3, pp. 336–343.
Schwanen, T. and D. Ettema (2009), ‘Coping with unreliable transportation when collecting children:
Examining parents’ behavior with cumulative prospect theory’, Transportation Research Part A: Policy and
Practice, Vol. 43, No. 5, pp. 511-525.
Schwanen, T., Dieleman, F. M. and M. Dijst (2001), ‘Travel behaviour in Dutch monocentric and
polycentric urban systems’, Journal of Transport Geography, Vol. 9, No. 3, pp. 173-186.
Schwanen, T., Dijst M. and F. M. Dieleman (2004), ‘Policies for urban form and their impact on travel:
The Netherlands experience’, Urban Studies, Vol. 41, No. 3, pp. 579–603.
Schwela, D., and O. Zali (1999), Urban Traffic Pollution, London: Spon.
Senbil, M. and R. Kitamura (2004), ‘Reference points in commuter departure time choice: a test of
alternative decision frames’, Journal of Intelligent Transport Systems, Vol. 8, No.1, pp. 19–31.
Sessa, C. (2007), ‘Achieving sustainable cities with integrated land use and transport strategies’, in
Marshall, S. and D. Banister (eds.), Land Use and Transport: European Research Towards Integrated Transport
Policies, Oxford: Elsevier, Chapter 4, pp. 37-70.
Shaheen, S. A. and A. P. Cohen (2007), ‘Growth in Worldwide Carsharing: An International Comparison’,
Transportation Research Record, No. 1992, pp. 81-89.
Shaheen, S. A., Cohen, A. P. and J. D. Roberts (2006), ‘Carsharing in North America: Market Growth,
Current Developments, and Future Potential’, Transportation Research Record, No. 1986, pp. 116-124.
Shaheen, S. A. and C. J. Rodier (2008), EasyConnect: Low-Speed Modes Linked to Transit Planning Project,
Research Report, California PATH, UCB-ITS-PRR-2008-17, October.
Shaheen, S. A., Sperling, D. and C. Wagner (1998), ‘Carsharing in Europe and North America: Past,
Present, and Future’, Transportation Quarterly, Vol. 52, No. 3, pp. 35-52.
Shoup, D. C. (2006), ‘Cruising for parking’, Transport Policy, Vol. 13, No. 6, pp. 479-486.
Sichelschmidt, H. (1999), ‘The EU programme “trans-European networks”- a critical assessment’,
Transport Policy, Vol. 6, No. 3 pp. 169-181.
Singh, S. K. (2005), ‘Review of Urban Transportation in India’, Journal of Public Transportation, Vol. 8, No.
1, pp. 79-97.
Sivaraman, D., Pacca, S., Mueller, K. and J. Lin (2007), ‘Comparative Energy, Environmental, and
Economic Analysis of Traditional and E-commerce DVD Rental Networks’, Journal of Industrial Ecology,
Vol. 11, No 3, pp. 77-91.
Skeer, J. and Y. Wang (2007), ‘China on the move: Oil price explosion?’, Energy Policy, Vol. 35, No. 1, pp.
678–691.
Skinner, R. (2004), Bogotá, Cities, Vol. 21, No. 1, pp. 73–81.
Small, K. A. (2004), ‘Road Pricing and Public Transport’, in Santos, G. (ed.), Road Pricing: Theory and
Evidence, Oxford: Elsevier, Chapter 6, pp. 133-158.
Small, K. A. and E. T. Verhoef (2007), The Economics of Urban Transportation, London: Routledge.
Smith, H. and J. Raemakers (1998), ‘Land use pattern and transport in Curitiba’, Land Use Policy, Vol. 15,
No. 3, pp .233-251.
Smokers, R., Vermeulen, R., van Mieghem, R., Gense, R., Skinner, I., Fergusson, M., Mackay, E., ten
Brink, P., Fontaras, G. and Z. Samaras (2006), Review and analysis of the reduction potential and costs of
technological and other measures to reduce CO2-emissions from passenger cars, Final Report on behalf of the on
behalf of the European Commission (DG-ENTR).
Sonkin, B., Edwards, P., Roberts, I. and J. Green (2006), ‘Walking, cycling and transport safety: an
analysis of child road deaths’, Journal of the Royal Society of Medicine, Vol. 99, No. 8, pp. 402-405.
Sperling, D. and D. Gordon (2008), ‘Two Billion Cars: Transforming a Culture’, Transportation Research
News, No. 259, November-December, pp. 3-9.
Spinks,W.A.(1991), ‘Satellite and resort offices in Japan’, Transportation, Vol. 18, No. 4, pp. 343-369.
Starkey, P., Ellis, S., Hine, J. and A. Ternell (2002), Improving Rural Mobility: Options for Developing Motorized
and Nonmotorized Transport in Rural Areas, Technical Paper No. 525, World Bank: Washington, DC.
Stead, D. (2008), ‘Institutional aspects of integrating transport, environment and health policies’, Transport
Policy, Vol. 15, No. 3, pp.139-148.
Steenhof, P., Woudsma, C. and E. Sparling (2006), ‘Greenhouse gas emissions and the surface transport
of freight in Canada’, Transportation Research Part D: Transport and Environment, Vol. 11, No. 5, pp. 369-376.
Steg, L. (2005), ‘Car use: lust and must: Instrumental, symbolic and affective motives for car use’,
Transportation Research Part A: Policy and Practice, Vol. 39, No. 2-3, pp. 147–162.
Steininger, K., Vogl C. and R. Zettl (1996), ‘Car-sharing organizations: The size of the market segment
and revealed change in mobility behavior’, Transport Policy, Vol. 3. No. 4, pp. 177-185.
Stern, N. (2006), Stern Review: The Economics of Climate Change, report to the Prime Minister and Chancellor, HM
Treasury, London. http://www.hm-treasury.gov.uk/sternreview_index.htm
Storper, M. and A. J. Venables (2004), ‘Buzz: face-to-face contact and the urban economy’, Journal of
Economic Geography, Vol. 4, No. 4, pp. 351-370.
Stubbs, M. (2002), ‘Car Parking and Residential Development: Sustainability, Design and Planning Policy,
and Public Perceptions of Parking Provision’, Journal of Urban Design, Vol. 7, No. 2, pp. 213-237.
Sustrans (2008), Carbon savings from active travel interventions. Sustrans report to the Committee on Climate Change,
Bristol, July.
TfL (2005), Proposed Western Extension of the Central London Congestion Charging Scheme. Report to the Mayor,
Transport for London, September
http://www.tfl.gov.uk/assets/downloads/Report-to-the-Mayor-2005.pdf
TfL (2007), Central London Congestion Charging: Impacts Monitoring. Fifth Annual Report, Transport for
London, July.
www.tfl.gov.uk/assets/downloads/fifth-annual-impacts-monitoringreport- 2007-07-07.pdf
TfL (2008), Central London Congestion Charging: Impacts monitoring,
Sixth Annual Report, Transport for London, July.
http://www.tfl.gov.uk/assets/downloads/sixth-annual-impacts-monitoring-report-2008-07.pdf
Thomas, S., Acton, C., Nixon, J., Battistutta, D., Pitt, W. R. and R. Clark (1994), ‘Effectiveness of bicycle
helmets in preventing head injury in children: case-control study’, British Medical Journal, Vol. 308, No.
6922, pp. 173-176.
Toyota (2009), FY2009 Financial Results, Presentation, Toyota Motor Corporation, 8 May.
http://www.toyota.co.jp/en/ir/financial_results/2009/year_end/presentation.pdf
Turnbull, K., Evans, J. and H. Levinson (2004), ‘Park-and-Ride/Pool: Traveler Response to Transport
System Changes’, in Transportation Research Board, Transit Cooperative Research Program, Report No. 95,
Washington DC, Chapter 3. http://gulliver.trb.org/publications/tcrp/tcrp_rpt_95c3.pdf.
Turner, S. A., Roozenburg, A. P. and T. Francis (2006), Predicting Accident Rates for Cyclists and Pedestrians,
Research Report 289, Land Transport New Zealand.
Tversky, A. and D. Kahneman (1991), ‘Loss Aversion in Riskless Choice: A Reference Dependent
Model’, Quarterly Journal of Economics, Vol. 107, No. 4, pp. 1039-1061.
Tversky, A. and D. Kahneman (1992), ‘Advances in prospect theory: Cumulative representation of
uncertainty’, Journal of Risk and Uncertainty, Vol. 5, No. 4, pp. 297-323.
UK Commission for Integrated Transport (2000), ‘Physical Integration’, London.
http://www.cfit.gov.uk/docs/2000/physical/physical/index.htm.
UK Commission for Integrated Transport (2008), A New Approach to Rural Public Transport, London,
November. http://www.cfit.gov.uk/docs/2008/rpt/report/pdf/rpt.pdf
UK Commission for Integrated Transport (2009), Public subsidy for the bus industry: the case for incentive per
passenger, London, March.
http://www.cfit.gov.uk/docs/2009/psbi/index.htm
UK DEFRA (2007), Guidelines to Defra’s GHG conversion factors for company reporting, annexes updated June 2007,
Department for Environment, Food and Rural Affairs, London, June.
http://www.defra.gov.uk/environment/business/reporting/pdf/conversion-factors.pdf
UK Department of Transport (1989), Roads for Prosperity - White Paper, London: HMSO.
UK DETR (1997), Developing an Integrated Transport Policy, Department of the Environment, Transport and
the Regions, London.
http://www.dft.gov.uk/about/strategy/whitepapers/previous/developinganintegratedtransp5697
UK DETR (1998), A new deal for transport: better for everyone - White Paper, Department of the Environment,
Transport and the Regions, London.
http://www.dft.gov.uk/adobepdf/187604/A_new_deal_for_transport_be1.pdf
UK DETR (2000), Encouraging walking: advice to local authorities, Department of the Environment, Transport
and the Regions - London, March.
UK DfT (2005), Making smarter choices work, Department for Transport, London: DfT Publication, August.
http://www.dft.gov.uk/pgr/sustainable/smarterchoices/makingwork/
UK DfT (2006), Focus on Freight, 2006 Edition, Department for Transport, London: TSO, December.
http://www.dft.gov.uk/pgr/statistics/datatablespublications/freight/focusonfreight/
UK DfT (2007a), Delivering a sustainable Railway, White Paper CM 7176, Department for Transport, London,
HMSO, April.
http://www.dft.gov.uk/about/strategy/whitepapers/whitepapercm7176/
UK DfT (2007b), Walking - Personal Travel Factsheet, Department for Transport, London, January.
UK DfT (2007c), Towards a Sustainable Transport System: Supporting Economic Growth in a Low Carbon World,
Department for Transport, London, October.
http://www.dft.gov.uk/about/strategy/transportstrategy/pdfsustaintranssystem.pdf
UK DfT (2007d), Making Personal Travel Planning Work: Research Report, Department for Transport,
London, December.
http://www.dft.gov.uk/pgr/sustainable/travelplans/ptp/makingptpworkresearch.pdf
UK DfT (2008a), A Sustainable Future for Cycling, Department for Transport, January.
UK DfT (2008b), Transport Statistics Great Britain, Department for Transport, London: TSO, November.
UK DfT (2009a), Impact Assessment of the Carbon Reduction Strategy for Transport’, Department for Transport,
London, July. http://www.dft.gov.uk/pgr/sustainable/carbonreduction/ia.pdf
UK DfT (2009b), Low Carbon Transport: A Greener Future. A Carbon Reduction Strategy for Transport,
Department for Transport, July.
UK DfT (2009c), NATA Refresh: Appraisal for a Sustainable Transport System, Department for Transport,
London, April.
http://www.dft.gov.uk/consultations/archive/2008/consulnatarefresh/natarefresh2009.pdf
UK DfT (2009d), Road Statistics 2008: Traffic, Speeds and Congestion - Data Tables, Chapter 4, Department for
Transport.
http://www.dft.gov.uk/excel/173025/221412/221546/227050/261688/roadtraffdata08c4.xls
UK DfT (2009e), Impact Assessment of the Carbon Reduction Strategy for Transport, Department for Transport,
London, July. http://www.dft.gov.uk/pgr/sustainable/carbonreduction/ia.pdf
UK House of Commons Environmental Audit Committee (2006), Reducing Carbon Emissions from Transport:
Ninth Report of Session 2005-06, Volume I, London, August.
UK House of Commons Select Committee on Transport (2008), Fifth Report, London, April.
http://www.publications.parliament.uk/pa/cm200708/cmselect/cmtran/84/8405.htm.
UK Social Exclusion Unit (2003), Making the Connections: final report on transport and social exclusion, Cabinet
Office, London, February.
http://www.cabinetoffice.gov.uk/media/cabinetoffice/social_exclusion_task_force/assets/publications_
1997_to_2006/making_transport_2003.pdf
UN Commission on Environment and Development (1987), Our Common Future, Transmitted to the
General Assembly as an Annex to document A/42/427 - Development and International Co-operation:
Environment. http://www.un-documents.net/wced-ocf.htm
UNEP (2006), Class of 2006: Industry Report Cards on environment and social responsibility, United Nations
Environment Programme, 2006.
UNSD (2007), Millennium Development Goals Indicators, United Nations Statistics Division, Department of
Economic and Social Affairs. http://mdgs.un.org/unsd/mdg/Data.aspx
UN Secretariat (2007), World Population Prospects: The 2006 Revision and World Urbanization Prospects: The
2007 Revision, Population Division of the Department of Economic and Social Affairs of the United
Nations Secretariat. http://esa.un.org/unup
US DoE EIA (2009), International Energy Outlook 2009, DOE/EIA-0484, US Department of Energy,
Energy Information Administration, Washington D.C., May.
http://www.eia.doe.gov/oiaf/ieo/pdf/0484(2009).pdf
US DoT (2006), Freight in America: A New national picture, US Department of Transportation, Research and
Innovative Technology Administration, Bureau of Transportation Statistics, January.
US EPA (1992), Transportation Control Measure Information Documents, Environmental Protection Agency,
Washington, DC: Office of Air and Radiation.
Vandegrift, D. and T. Yoked (2004), ‘Obesity rates, income, and suburban sprawl: an analysis of US
states’, Health & Place, Vol. 10, No. 3, pp. 221-229.
Van Dender, K. (2009), ‘Energy Policy in Transport and Transport Policy’, Energy Policy, Vol. 37, N°10,
pp. 3854-3862.
Van Der Burg, A. J. and F. M. Dieleman (2004), ‘Dutch Urbanisation Policies: From ‘Compact City’ To
‘Urban Network’, Tijdschrift voor Economische en Sociale Geografie, Vol. 95, No. 1, pp. 108-116.
Van de Walle, D. (2002), ‘Choosing Rural Road Investments to Help Reduce Poverty’, World Development,
Vol. 30, No. 4, pp. 575-589.
Van Goeverden, C., Rietveld, P., Koelemeijer, J. and P. Peeters (2006), ‘Subsidies in public transport’,
European Transport \ Trasporti Europei, No. 32, pp. 5-25.
Van Ierland, E., Graveland, C. and R. Huiberts (2000), ‘An environmental economic analysis of the new
rail link to European main port Rotterdam’, Transportation Research Part D: Transport and Environment, Vol.
5, No. 3, pp. 197-209.
Van Wee, Bert (2009), ‘Self-Selection: A Key to a Better Understanding of Location Choices, Travel
Behaviour and Transport Externalities?’, Transport Reviews, Vol. 29, No. 3, pp. 279-292.
Vassallo, J. M., De Villar, P. P., Muñoz-Raskin, R. and T. Serebrisky, (2009), ‘Public Transport Funding
Policy in Madrid: Is There Room for Improvement?’, Transport Reviews, Vol. 29, No. 2, pp. 261-278.
Vickerman, R., (2000), ‘Evaluation methodologies for transport projects in the United Kingdom’,
Transport Policy, Vol. 7, pp. 7-16.
von Neumann, J. and O. Morgenstern (1944), Theory of Games and Economic Behavior, Princeton University
Press: Princeton.
Vuk, G. (2005), ‘Transport Impacts of the Copenhagen Metro’, Journal of Transport Geography, Vol.13, No.
3, pp. 223-233.
Weltevreden, J. W. J. (2007), ‘Substitution or complementarity? How the Internet changes city centre
shopping’, Journal of Retailing and Consumer Services, Vol. 14, No. 3, pp. 192-207.
Weltevreden, J. W. J. and O. Rotem-Mindali (2008), Mobility effects of b2c and c2c e-commerce: a literature review
and assessment, presented at Third International Specialist Meeting on ICT, Everyday Life and Urban
Change, 16-19 March.
http://www.transport.uwe.ac.uk/ICTs-meeting/weltevreden_and_rotem-mindali.pdf
Weltevreden, J. W. J. and O. Rotem-Mindali (2009), ‘Mobility effects of b2c and c2c e-commerce in the
Netherlands: a quantitative assessment’, Journal of Transport Geography, Vol. 17, No. 2, pp. 83-92.
Whitehead, T., Simmonds, D. and J. Preston (2006), ‘The effect of urban quality improvements on
economic activity’, Journal of Environmental Management, Vol. 80, No. 1, pp. 1-12.
Williams, E. and T. Tagami (2003), ‘Energy Use in Sales and Distribution via E-Commerce and
Conventional Retail. A Case Study of the Japanese Book Sector’, Journal of Industrial Ecology, Vol. 6, No. 2,
pp. 99-114.
Woodburn, A. (2003), ‘A Logistical perspective on the potential for modal shift of freight from road to
rail in Great Britain’, International Journal of Transport Management, Vol. 1, No. 4, pp. 237-245.
Woodcock, J., Banister, D., Edwards, P., Prentice, A. and I. Roberts (2007), ‘Energy and health 3 Energy and transport’, Lancet, Vol. 370, No. 9592, pp. 1078-1088.
World Bank (2006), World Development Indicators, World Bank: Washington DC, April.
World Bank (2007), World Development Indicators, World Bank: Washington DC, April.
World Bank (2009), World Development Indicators, World Bank: Washington DC, April.
World Health Organisation (2009), Global status report on road safety: time for action, World Health
Organization, Geneva.
http://www.who.int/violence_injury_prevention/road_safety_status/2009
Wright, C. and J. Egan (2000), ‘De-marketing the car’, Transport Policy, Vol. 7, No. 4, pp. 287-294.
Wright, L. and L. Fulton (2005), ‘Climate Change Mitigation and Transport in Developing Nations’,
Transport Reviews, Vol. 25, No. 6, pp. 691-717.
Yamano, T. and T. S. Jayne (2005), ‘Working-Age Adult Mortality and Primary School Attendance in
Rural Kenya’, Economic Development and Cultural Change, Vol. 53, No. 3, pp. 619-653.
Zarkadoula, M., Zoidis, G. and E. Tritopoulou (2007), ‘Training urban bus drivers to promote smart
driving: A note on a Greek eco-driving pilot program’, Transportation Research Part D, Vol.12, No. 6, pp.
449–451.
Zhang, M. (2004), ‘The Role of Land Use in Travel Mode Choice: Evidence from Boston and Hong
Kong’, Journal of the American Planning Association, Vol. 70, No. 3, pp. 344-360.
Keep reading this paper — and 50 million others — with a free Academia account
Used by leading Academics

omer emirkadi
Karadeniz Technical University
busayo aderounmu
Covenant University Canaanland, Ota.

Don Ross
University College Cork

Esther Aderinto
Lead City University , Ibadan Nigeria